Sony 2008 Annual Report Download - page 5
Download and view the complete annual report
Please find page 5 of the 2008 Sony annual report below. You can navigate through the pages in the report by either clicking on the pages listed below, or by using the keyword search tool below to find specific information within the annual report.-
 1
1 -
 2
2 -
 3
3 -
 4
4 -
 5
5 -
 6
6 -
 7
7 -
 8
8 -
 9
9 -
 10
10 -
 11
11 -
 12
12 -
 13
13 -
 14
14 -
 15
15 -
 16
16 -
17
-
18
-
19
-
20
-
21
-
22
-
23
-
24
-
25
-
26
-
27
-
28
-
29
-
30
-
31
-
32
-
33
-
34
-
35
-
36
-
37
-
38
-
39
-
40
-
41
-
42
-
43
-
44
-
45
-
46
-
47
-
48
-
49
-
50
-
51
-
52
-
53
-
54
-
55
-
56
-
57
-
58
-
59
-
60
-
61
-
62
-
63
-
64
-
65
-
66
-
67
-
68
-
69
-
70
-
71
-
72
-
73
-
74
-
75
-
76
-
77
-
78
-
79
-
80
-
81
-
82
-
83
-
84
-
85
-
86
-
87
-
88
-
89
-
90
-
91
-
92
-
93
-
94
-
95
-
96
-
97
-
98
-
99
-
100
-
101
-
102
-
103
-
104
-
105
-
106
 |
 |

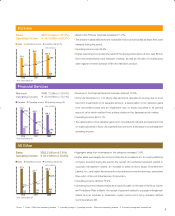
3
743.2
649.3
13.0%
581.1
3.9%
188.3
25.3%
84.1
(Yen in billions)
22.6
2006 2007 2008
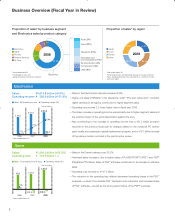
Aggregate sales from businesses in this category increased 7.6%.
Higher sales were largely due to the contribution from sales at a U.S. music publishing
company acquired during the period, the receipt of a settlement payment related to
copyright infringement claims, an increase in sales at Sony Music Entertainment
(Japan), Inc., and higher fee revenue from broadband connection services, particularly
fi ber-optic, at So-net Entertainment Corporation.
Operating income climbed 73.9%.
Operating income increased mainly as a result of a gain on the sale of the Sony Center
am Potsdamer Platz in Berlin, the receipt of payment related to copyright infringement
claims and an increase in trademark royalty income from Sony Ericsson Mobile
Communications AB.
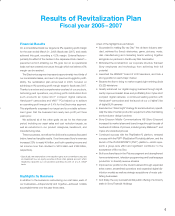
Sales: ¥857.9 billion (–11.2%)
Operating income: ¥ 54.0 billion (+26.5%)
Revenue: ¥581.1 billion (–10.5%)
Operating income: ¥ 22.6 billion (–73.1%)
Sales: ¥382.2 billion (+7.6%)
Operating income: ¥ 50.2 billion (+73.9%)
745.9
966.3
4.4.%
857.9
6.3%
27.4
3.7%
42.7
(Yen in billions)
54.0
2006 2007 2008
411.5
355.1
8.1%
382.2
13.1%
18.8
4.8%
28.9
(Yen in billions)
50.2
2006 2007 2008
Pictures
Financial Services
All Other
*Years ended March 31
*Years ended March 31
*Years ended March 31
Sales Operating income Operating margin (%)
Revenue Operating income Operating margin (%)
Sales Operating income Operating margin (%)
Sales in the Pictures business decreased 11.2%.
The decline in sales refl ected lower worldwide motion pictures sales as fewer fi lms were
released during the period.
Operating income rose 26.5%.
Higher operating income was the result of the strong performance of prior year fi lms in
the home entertainment and television markets, as well as the sale of a bankruptcy
claim against a former licensee of fi lm and television product.
Revenue in the Financial Services business declined 10.5%.
Sony Life Insurance Co., Ltd. (Sony Life) reported a decrease in revenue due to a net
loss from investments in its separate account, a deterioration of net valuation gains
from convertible bonds and an impairment loss on equity securities in its general
account, all of which resulted from a sharp decline in the Japanese stock market.
Operating income fell 73.1%.
The deterioration of net valuation gains from convertible bonds and an impairment loss
on equity securities in Sony Life’s general account led to a decrease in overall segment
operating income.
Notes: 1. Sales = Sales and operating revenue 2. Operating margin = Operating income ÷ Sales and operating revenue 3. Includes intersegment transactions
08SonyE_P1_P13_0804.indd 308SonyE_P1_P13_0804.indd 3 08.8.7 2:17:38 PM08.8.7 2:17:38 PM