Sony 2008 Annual Report Download - page 66
Download and view the complete annual report
Please find page 66 of the 2008 Sony annual report below. You can navigate through the pages in the report by either clicking on the pages listed below, or by using the keyword search tool below to find specific information within the annual report.-
 1
1 -
2
-
3
-
4
-
5
-
6
-
7
-
8
-
9
-
10
-
11
-
12
-
13
-
14
-
15
-
16
-
17
-
18
-
19
-
20
-
21
-
22
-
23
-
24
-
25
-
26
-
27
-
28
-
29
-
30
-
31
-
32
-
33
-
34
-
35
-
36
-
37
-
38
-
39
-
40
-
41
-
42
-
43
-
44
-
45
-
46
-
47
-
48
-
49
-
50
-
51
-
52
-
53
-
54
-
55
-
 56
56 -
 57
57 -
 58
58 -
 59
59 -
 60
60 -
 61
61 -
 62
62 -
 63
63 -
 64
64 -
 65
65 -
 66
66 -
 67
67 -
 68
68 -
 69
69 -
 70
70 -
 71
71 -
 72
72 -
 73
73 -
 74
74 -
 75
75 -
 76
76 -
77
-
78
-
79
-
80
-
81
-
82
-
83
-
84
-
85
-
86
-
87
-
88
-
89
-
90
-
91
-
92
-
93
-
94
-
95
-
96
-
97
-
98
-
99
-
100
-
101
-
102
-
103
-
104
-
105
-
106
 |
 |

64
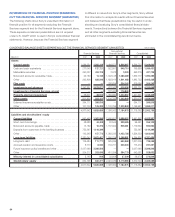
CONDENSED BALANCE SHEETS SEPARATING OUT THE FINANCIAL SERVICES SEGMENT (UNAUDITED)
Yen in millions
Sony without
Financial Services Financial Services Consolidated
March 31 2007 2008 2007 2008 2007 2008
Assets
Current assets ....................................
1,089,254 1,205,119 3,494,971 3,836,667 4,546,723 5,009,663
Cash and cash equivalents ...........................
277,048 137,721 522,851 948,710 799,899 1,086,431
Marketable securities ................................
490,237 424,709 3,078 3,000 493,315 427,709
Notes and accounts receivable, trade ....................
29,163 14,143 1,343,128 1,083,489 1,369,777 1,090,285
Other ............................................
292,806 628,546 1,625,914 1,801,468 1,883,732 2,405,238
Film costs .......................................
—
— 308,694 304,243 308,694 304,243
Investments and advances ..........................
3,347,897 3,879,877 623,342 518,536 3,888,736 4,335,648
Investments in Financial Services, at cost ..............
—
— 187,400 116,843
—
—
Property, plant and equipment .......................
38,671 38,512 1,382,860 1,204,837 1,421,531 1,243,349
Other assets .....................................
501,820 502,151 1,100,795 1,203,849 1,550,678 1,659,836
Deferred insurance acquisition costs. . . . . . . . . . . . . . . . . . . . .
394,117 396,819 — — 394,117 396,819
Other ............................................
107,703 105,332 1,100,795 1,203,849 1,156,561 1,263,017
.................................................
4,977,642 5,625,659 7,098,062 7,184,975 11,716,362 12,552,739
Liabilities and stockholders’ equity
Current liabilities ..................................
957,459 1,362,956 2,640,601 2,698,522 3,551,852 4,023,367
Short-term borrowings ...............................
48,688 44,408 80,944 339,485 95,461 355,103
Notes and accounts payable, trade .....................
13,159 16,376 1,167,324 906,281 1,179,694 920,920
Deposits from customers in the banking business ..........
752,367 1,144,399 — — 752,367 1,144,399
Other ............................................
143,245 157,773 1,392,333 1,452,756 1,524,330 1,602,945
Long-term liabilities ................................
3,380,240 3,621,407 1,500,314 1,268,951 4,754,836 4,787,434
Long-term debt ....................................
129,484 111,771 925,259 650,969 1,001,005 729,059
Accrued pension and severance costs ...................
8,773 8,034 164,701 223,203 173,474 231,237
Future insurance policy benefits and other ................
3,037,666 3,298,506 — — 3,037,666 3,298,506
Other ............................................
204,317 203,096 410,354 394,779 542,691 528,632
Minority interest in consolidated subsidiaries ...........
5,145 919 32,808 37,509 38,970 276,849
Stockholders’ equity ...............................
634,798 640,377 2,924,339 3,179,993 3,370,704 3,465,089
.................................................
4,977,642 5,625,659 7,098,062 7,184,975 11,716,362 12,552,739
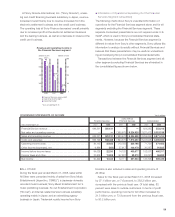
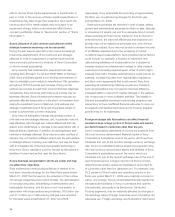
INFORMATION OF FINANCIAL POSITION SEPARATING
OUT THE FINANCIAL SERVICES SEGMENT (UNAUDITED)
The following charts show Sony’s unaudited information of
financial position for all segments excluding the Financial
Services segment and for the Financial Services segment alone.
These separate condensed presentations are not required
under U.S. GAAP, which is used in Sony’s consolidated financial
statements. However, because the Financial Services segment
is different in nature from Sony’s other segments, Sony utilizes
this information to analyze its results without Financial Services
and believes that these presentations may be useful in under-
standing and analyzing Sony’s consolidated financial state-
ments. Transactions between the Financial Services segment
and all other segments excluding Financial Services are
eliminated in the consolidated figures shown below.