Sony 2008 Annual Report Download - page 57
Download and view the complete annual report
Please find page 57 of the 2008 Sony annual report below. You can navigate through the pages in the report by either clicking on the pages listed below, or by using the keyword search tool below to find specific information within the annual report.-
 1
1 -
2
-
3
-
4
-
5
-
6
-
7
-
8
-
9
-
10
-
11
-
12
-
13
-
14
-
15
-
16
-
17
-
18
-
19
-
20
-
21
-
22
-
23
-
24
-
25
-
26
-
27
-
28
-
29
-
30
-
31
-
32
-
33
-
34
-
35
-
36
-
37
-
38
-
39
-
40
-
41
-
42
-
43
-
44
-
45
-
46
-
 47
47 -
 48
48 -
 49
49 -
 50
50 -
 51
51 -
 52
52 -
 53
53 -
 54
54 -
 55
55 -
 56
56 -
 57
57 -
 58
58 -
 59
59 -
 60
60 -
 61
61 -
 62
62 -
 63
63 -
 64
64 -
 65
65 -
 66
66 -
 67
67 -
68
-
69
-
70
-
71
-
72
-
73
-
74
-
75
-
76
-
77
-
78
-
79
-
80
-
81
-
82
-
83
-
84
-
85
-
86
-
87
-
88
-
89
-
90
-
91
-
92
-
93
-
94
-
95
-
96
-
97
-
98
-
99
-
100
-
101
-
102
-
103
-
104
-
105
-
106
 |
 |
55
OPERATING PERFORMANCE BY BUSINESS SEGMENT
The following discussion is based on segment information.
Sales and operating revenue in each business segment include
intersegment transactions. Refer to Note 24 of Notes to
Consolidated Financial Statements.
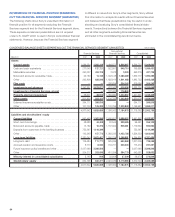
BUSINESS SEGMENT INFORMATION
Yen in billions Percent change
Years ended March 31 2007 2008 2008/2007
Sales and operating revenue
Electronics . . . . . . . . . . . .
6,072.4 6,613.8 +8.9%
Game ................
1,016.8 1,284.2 +26.3
Pictures . . . . . . . . . . . . . .
966.3 857.9 –11.2
Financial Services .......
649.3 581.1 –10.5
All Other . . . . . . . . . . . . . .
355.1 382.2 +7.6
Elimination . . . . . . . . . . . .
(764.2) (847.9) —
Consolidated . . . . . . . . . . . .
8,295.7 8,871.4 +6.9
Operating income (loss)
Electronics . . . . . . . . . . . .
160.5 356.0 +121.8%
Game ................
(232.3) (124.5) —
Pictures . . . . . . . . . . . . . .
42.7 54.0 +26.5
Financial Services .......
84.1 22.6 –73.1
All Other . . . . . . . . . . . . . .
28.9 50.2 +73.9
Sub-Total ...............
83.9 358.4 +327.0
Elimination and unallocated
corporate expenses/
gains ................
(12.2) 16.1 —
Consolidated . . . . . . . . . . . .
71.8 374.5 +421.9
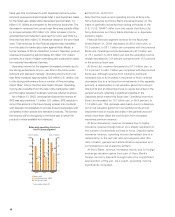
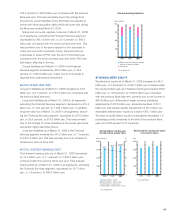
■ ELECTRONICS
Sales and operating revenue for the fiscal year ended March 31,
2008 increased 541.4 billion yen, or 8.9 percent, to 6,613.8
billion yen compared with the previous fiscal year. Operating
income increased by 195.5 billion yen, or 121.8 percent, to
356.0 billion yen compared with the previous fiscal year and the
operating income to sales ratio increased from 2.6 percent to
5.4 percent. Sales to outside customers increased 9.0 percent
compared to the previous fiscal year. Regarding sales to outside
customers by geographical area, sales decreased by 2 percent
in Japan, but increased by 2 percent in the U.S., by 11 percent
in Europe, and by 19 percent in non-Japan Asia and other
geographic areas (“Other Areas”).
In Japan, sales of products such as CCDs and CMOS imag-
ing sensors increased while sales of mobile phones produced
for wireless customers decreased. In the U.S., sales of products
such as LCD rear-projection and CRT televisions decreased
while sales of products such as LCD televisions, compact digital
cameras and PCs increased. In Europe, sales of products such
as LCD televisions and PCs increased while sales of mobile
phones produced for wireless customers decreased. In Other
Areas, sales of LCD televisions, compact digital cameras and
PCs increased while sales of CRT televisions decreased.
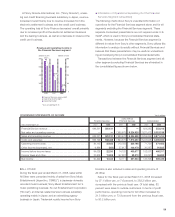
●¥Performance by Product Category
Sales and operating revenue by product category discussed
below represent sales to outside customers, which do not
include intersegment transactions. Refer to Note 24 of Notes
to Consolidated Financial Statements.
“Audio” sales increased by 35.7 billion yen, or 6.8 percent, to
558.6 billion yen. Sales of flash memory digital audio players
increased as worldwide unit shipments increased by approxi-
mately 1.3 million units to approximately 5.8 million units. Sales
of home audio, headphones and personal navigation systems
also increased. On the other hand, due to a shift in market
demand, sales of CD format headphone stereos decreased.
“Video” sales increased by 136.1 billion yen, or 11.9 percent,
to 1,279.2 billion yen. Sales of compact digital cameras
increased as worldwide unit shipments increased by approxi-
mately 6.5 million units to approximately 23.5 million units.
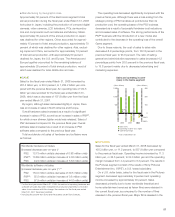
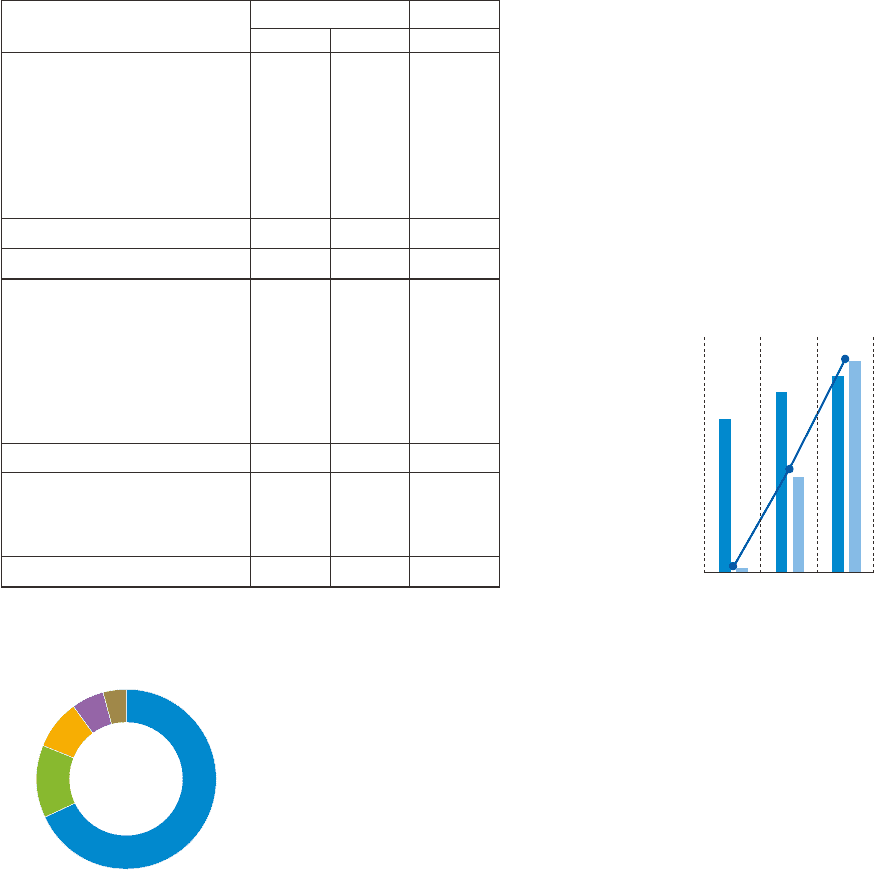
■¥Electronics
■¥Game
■¥Pictures
■¥Financial Services
■¥All Other
* Year ended March 31, 2008
* Including intersegment transactions
Shares of sales and operating revenue by business segment
13.2%
68.1%
8.8%
6.0%3.9%
(Yen in trillions) (Yen in billions)
Sales and operating income
in the Electronics segment
■¥Sales (left)
■¥Operating income (right)
●¥Operating margin
* Years ended March 31
8
6
4
2
0
400
300
200
100
0
2006 2007 2008
0.1%
2.6%
5.4%