Sony 2008 Annual Report Download - page 93
Download and view the complete annual report
Please find page 93 of the 2008 Sony annual report below. You can navigate through the pages in the report by either clicking on the pages listed below, or by using the keyword search tool below to find specific information within the annual report.-
 1
1 -
2
-
3
-
4
-
5
-
6
-
7
-
8
-
9
-
10
-
11
-
12
-
13
-
14
-
15
-
16
-
17
-
18
-
19
-
20
-
21
-
22
-
23
-
24
-
25
-
26
-
27
-
28
-
29
-
30
-
31
-
32
-
33
-
34
-
35
-
36
-
37
-
38
-
39
-
40
-
41
-
42
-
43
-
44
-
45
-
46
-
47
-
48
-
49
-
50
-
51
-
52
-
53
-
54
-
55
-
56
-
57
-
58
-
59
-
60
-
61
-
62
-
63
-
64
-
65
-
66
-
67
-
68
-
69
-
70
-
71
-
72
-
73
-
74
-
75
-
76
-
77
-
78
-
79
-
80
-
81
-
82
-
 83
83 -
 84
84 -
 85
85 -
 86
86 -
 87
87 -
 88
88 -
 89
89 -
 90
90 -
 91
91 -
 92
92 -
 93
93 -
 94
94 -
 95
95 -
 96
96 -
 97
97 -
 98
98 -
 99
99 -
 100
100 -
 101
101 -
 102
102 -
 103
103 -
104
-
105
-
106
 |
 |

91
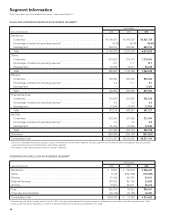
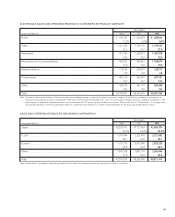
ELECTRONICS SALES AND OPERATING REVENUE TO CUSTOMERS BY PRODUCT CATEGORY
Yen in millions
Years ended March 31 2006 2007 2008
Audio ............................................................
¥ 536,187 ¥ 522,879 ¥ 558,624
........................................................................ 11.2% 9.6% 9.4%
Video ............................................................
1,021,325 1,143,120 1,279,225
................................................................
21.3 21.0 21.6
Televisions ........................................................
927,769 1,226,971 1,367,078
................................................................
19.3 22.5 23.0
Information and Communications .......................................
842,537 950,461 1,098,574
................................................................
17.6 17.5 18.5
Semiconductors ....................................................
172,249 205,757 228,711
................................................................
3.6 3.8 3.9
Components ......................................................
800,716 852,981 847,131
................................................................
16.7 15.7 14.3
Other ............................................................
495,278 541,167 552,365
................................................................
10.3 9.9 9.3
Total .............................................................
¥4,796,061 ¥5,443,336 ¥5,931,708
Note: The above table is a breakdown of Electronics sales and operating revenue to external customers by product category. The Electronics segment is managed as a
single operating segment by Sony’s management. Effective for the fiscal year ended March 31, 2007, Sony has partly changed its product category configuration. The
main change is that the low-temperature polysilicon thin film transistor LCD product group has been moved from “Semiconductors” to “Components.” Accordingly, sales
and operating revenue for the fiscal year ended March 31, 2006 have been restated to conform to the presentation for the fiscal year ended March 31, 2007.
SALES AND OPERATING REVENUE BY GEOGRAPHIC INFORMATION
Yen in millions
Years ended March 31 2006 2007 2008
Japan ............................................................
¥2,203,812 ¥2,127,841 ¥2,056,374
........................................................................ 29.3% 25.6% 23.2%
U.S.A. ...........................................................
1,957,644 2,232,453 2,221,862
........................................................................ 26.1 26.9 25.1
Europe ...........................................................
1,715,775 2,037,658 2,328,233
........................................................................ 22.8 24.6 26.2
Other ............................................................
1,633,366 1,897,743 2,264,945
........................................................................ 21.8 22.9 25.5
Total .............................................................
¥7,510,597 ¥8,295,695 ¥8,871,414
Note: Classification of geographic segment information shows sales and operating revenue recognized by location of customers.