Sony 2008 Annual Report Download - page 4
Download and view the complete annual report
Please find page 4 of the 2008 Sony annual report below. You can navigate through the pages in the report by either clicking on the pages listed below, or by using the keyword search tool below to find specific information within the annual report.-
 1
1 -
 2
2 -
 3
3 -
 4
4 -
 5
5 -
 6
6 -
 7
7 -
 8
8 -
 9
9 -
 10
10 -
 11
11 -
 12
12 -
 13
13 -
 14
14 -
 15
15 -
16
-
17
-
18
-
19
-
20
-
21
-
22
-
23
-
24
-
25
-
26
-
27
-
28
-
29
-
30
-
31
-
32
-
33
-
34
-
35
-
36
-
37
-
38
-
39
-
40
-
41
-
42
-
43
-
44
-
45
-
46
-
47
-
48
-
49
-
50
-
51
-
52
-
53
-
54
-
55
-
56
-
57
-
58
-
59
-
60
-
61
-
62
-
63
-
64
-
65
-
66
-
67
-
68
-
69
-
70
-
71
-
72
-
73
-
74
-
75
-
76
-
77
-
78
-
79
-
80
-
81
-
82
-
83
-
84
-
85
-
86
-
87
-
88
-
89
-
90
-
91
-
92
-
93
-
94
-
95
-
96
-
97
-
98
-
99
-
100
-
101
-
102
-
103
-
104
-
105
-
106
 |
 |

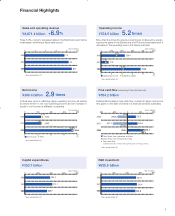
2
0.9%
958.6 1,016.8
1,284.2
8.7
(232.3)
(Yen in billions)
(124.5)
2006 2007 2008
5,190.2
6,072.4
2.6%
6,613.8
5.4%
8.8
0.1% 160.5
(Yen in billions)
356.0
2006 2007 2008
*Years ended March 31
*Years ended March 31
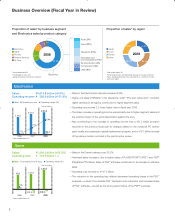
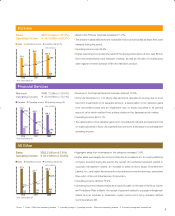
Electronics
Sales: ¥6,613.8 billion (+8.9%)
Operating income: ¥ 356.0 billion (+121.8%)
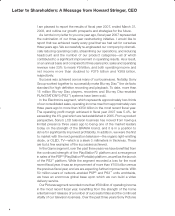
Sales: ¥1,284.2 billion (+26.3%)
Operating loss: ¥ 124.5 billion ( – )
Game
Business Overview (Fiscal Year in Review)
Japan
U.S.A.
Europe
Other
*Year ended March 31
*Percentage of sales and
operating revenue to outside customers
*Year ended March 31
*Percentage of sales and operating revenue to outside customers
*Sales and operating revenue accounted for by customers in each
particular region
25.1%
23.2%
26.2%
25.5%
2008
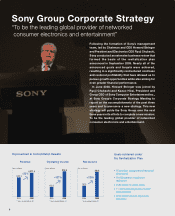
Proportion of sales* by business segment
and Electronics sales by product category
Proportion of sales* by region
Sales Operating income Operating margin (%)
Sales Operating income (loss) Operating margin (%)
Electronics
Game
Pictures
Financial Services
All Other
13.7%
66.9%
9.7%
6.2%
3.5%
Audio (9%)
Electronics
Video (22%)
Televisions (23%)
Information and
Communications (19%)
Semiconductors (4%)
Components (14%)
Other (9%)
2008
Sales in the Electronics business increased 8.9%.
Higher unit sales of BRAVIA™ LCD televisions, VAIO™ PCs and Cyber-shot™ compact
digital cameras in all regions contributed to higher segment sales.
Operating income was 2.2 times higher than in fi scal year 2006.
The sharp increase in operating income was primarily due to higher segment sales and
the positive impact of the yen’s depreciation against the euro.
Also contributing to the increase in operating income was a ¥51.2 billion provision
recorded in the previous fi scal year for charges related to the notebook PC battery
pack recalls and subsequent global replacement program, and a ¥15.7 billion reversal
of the same provision recorded in the period under review.
Sales in the Game business rose 26.3%.
Hardware sales increased, due to higher sales of PLAYSTATION®3 (PS3™) and PSP®
(PlayStation®Portable). Sales of PS3™ software contributed to an increase in software
sales.
Operating loss reduced by ¥107.8 billion.
The reduction in the operating loss refl ects decreased operating losses in the PS3™
business—a result of successful PS3™ hardware cost reductions and increased sales
of PS3™ software—as well as the strong performance of the PSP® business.
08SonyE_P1_P13_0804.indd 208SonyE_P1_P13_0804.indd 2 08.8.7 2:17:38 PM08.8.7 2:17:38 PM