Sony 2008 Annual Report Download - page 96
Download and view the complete annual report
Please find page 96 of the 2008 Sony annual report below. You can navigate through the pages in the report by either clicking on the pages listed below, or by using the keyword search tool below to find specific information within the annual report.-
 1
1 -
2
-
3
-
4
-
5
-
6
-
7
-
8
-
9
-
10
-
11
-
12
-
13
-
14
-
15
-
16
-
17
-
18
-
19
-
20
-
21
-
22
-
23
-
24
-
25
-
26
-
27
-
28
-
29
-
30
-
31
-
32
-
33
-
34
-
35
-
36
-
37
-
38
-
39
-
40
-
41
-
42
-
43
-
44
-
45
-
46
-
47
-
48
-
49
-
50
-
51
-
52
-
53
-
54
-
55
-
56
-
57
-
58
-
59
-
60
-
61
-
62
-
63
-
64
-
65
-
66
-
67
-
68
-
69
-
70
-
71
-
72
-
73
-
74
-
75
-
76
-
77
-
78
-
79
-
80
-
81
-
82
-
83
-
84
-
85
-
 86
86 -
 87
87 -
 88
88 -
 89
89 -
 90
90 -
 91
91 -
 92
92 -
 93
93 -
 94
94 -
 95
95 -
 96
96 -
 97
97 -
 98
98 -
 99
99 -
 100
100 -
 101
101 -
 102
102 -
 103
103 -
 104
104 -
 105
105 -
 106
106
 |
 |

94
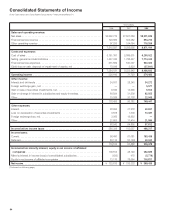
Yen in millions
2006 2007 2008
Sales and operating revenue:
Net sales .........................................................
¥6,692,776 ¥7,567,359 ¥8,201,839
Financial service revenue .............................................
720,566 624,282 553,216
Other operating revenue ..............................................
97,255 104,054 116,359
...............................................................
7,510,597 8,295,695 8,871,414
Costs and expenses:
Cost of sales ......................................................
5,151,397 5,889,601 6,290,022
Selling, general and administrative . . . . . . . . . . . . . . . . . . . . . . . . . . . . . . . . . . . . . .
1,527,036 1,788,427 1,714,445
Financial service expenses ............................................
531,809 540,097 530,306
(Gain) loss on sale, disposal or impairment of assets, net .....................
73,939 5,820 (37,841)
...............................................................
7,284,181 8,223,945 8,496,932
Operating income .................................................
226,416 71,750 374,482
Other income:
Interest and dividends ...............................................
24,937 28,240 34,272
Foreign exchange gain, net ...........................................
— — 5,571
Gain on sale of securities investments, net ................................
9,645 14,695 5,504
Gain on change in interest in subsidiaries and equity investees .................
60,834 31,509 82,055
Other ............................................................
23,039 20,738 22,045
...............................................................
118,455 95,182 149,447
Other expenses:
Interest ...........................................................
28,996 27,278 22,931
Loss on devaluation of securities investments . . . . . . . . . . . . . . . . . . . . . . . . . . . . .
3,878 1,308 13,087
Foreign exchange loss, net ............................................
3,065 18,835 —
Other ............................................................
22,603 17,474 21,594
...............................................................
58,542 64,895 57,612
Income before income taxes ........................................
286,329 102,037 466,317
Income taxes:
Current ...........................................................
96,400 67,081 183,438
Deferred ..........................................................
80,115 (13,193) 20,040
...............................................................
176,515 53,888 203,478
Income before minority interest, equity in net income of affiliated
companies ......................................................
109,814 48,149 262,839
Minority interest in income (loss) of consolidated subsidiaries ..................
(626) 475 (5,779)
Equity in net income of affiliated companies ...............................
13,176 78,654 100,817
Net income
........................................................
¥ 123,616 ¥ 126,328 ¥ 369,435
(Continued on following page)
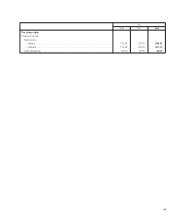
Consolidated Statements of Income
Sony Corporation and Consolidated Subsidiaries—Years ended March 31