Sony 2008 Annual Report Download - page 59
Download and view the complete annual report
Please find page 59 of the 2008 Sony annual report below. You can navigate through the pages in the report by either clicking on the pages listed below, or by using the keyword search tool below to find specific information within the annual report.-
 1
1 -
2
-
3
-
4
-
5
-
6
-
7
-
8
-
9
-
10
-
11
-
12
-
13
-
14
-
15
-
16
-
17
-
18
-
19
-
20
-
21
-
22
-
23
-
24
-
25
-
26
-
27
-
28
-
29
-
30
-
31
-
32
-
33
-
34
-
35
-
36
-
37
-
38
-
39
-
40
-
41
-
42
-
43
-
44
-
45
-
46
-
47
-
48
-
 49
49 -
 50
50 -
 51
51 -
 52
52 -
 53
53 -
 54
54 -
 55
55 -
 56
56 -
 57
57 -
 58
58 -
 59
59 -
 60
60 -
 61
61 -
 62
62 -
 63
63 -
 64
64 -
 65
65 -
 66
66 -
 67
67 -
 68
68 -
 69
69 -
70
-
71
-
72
-
73
-
74
-
75
-
76
-
77
-
78
-
79
-
80
-
81
-
82
-
83
-
84
-
85
-
86
-
87
-
88
-
89
-
90
-
91
-
92
-
93
-
94
-
95
-
96
-
97
-
98
-
99
-
100
-
101
-
102
-
103
-
104
-
105
-
106
 |
 |

57
The operating loss decreased significantly compared with the
previous fiscal year. Although there was a loss arising from the
strategic pricing of PS3 hardware at points lower than its
production cost, the operating losses of the PS3 business
decreased as a result of successful hardware cost reductions
and increased sales of software. The strong performance of the
PSP® business with the introduction of a new model also
contributed to the decrease in the operating loss of the overall
Game segment.
Due to these reasons, the cost of sales to sales ratio
decreased 8.9 percentage points, from 102.8 percent in the
previous fiscal year, to 93.9 percent. The ratio of selling,
general and administrative expenses to sales decreased 4.2
percentage points from 20.0 percent in the previous fiscal year,
to 15.8 percent mainly due to decreased advertising and
marketing expenses.
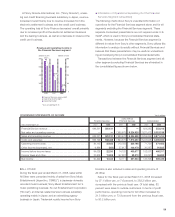
■ PICTURES
Sales for the fiscal year ended March 31, 2008 decreased by
108.3 billion yen, or 11.2 percent, to 857.9 billion yen compared
to the previous fiscal year. Operating income increased by 11.3
billion yen, or 26.5 percent, to 54.0 billion yen and the operating
margin increased from 4.4 percent to 6.3 percent. The results in
the Pictures segment consist of the results of Sony Pictures
Entertainment Inc. (“SPE”), a U.S.-based subsidiary.
On a U.S. dollar basis, sales for the fiscal year in the Pictures
segment decreased approximately 9 percent and operating
income increased by approximately 40 percent. Sales
decreased primarily due to lower worldwide theatrical and
home entertainment revenues as fewer films were released in
the current fiscal year, as compared to the number of films
released in the previous fiscal year. Major films released in the
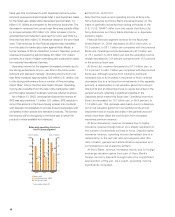
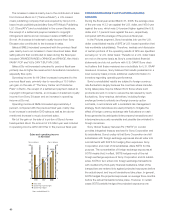
●¥Manufacturing by Geographic Area
Approximately 50 percent of the Electronics segment’s total
annual production during the fiscal year ended March 31, 2008
took place in Japan, including the production of compact digital
cameras, video cameras, LCD televisions, PCs, semiconduc-
tors and components such as batteries and Memory Sticks.
Approximately 60 percent of the annual production in Japan
was destined for other regions. China accounted for approxi-
mately 15 percent of total annual production, approximately 70
percent of which was destined for other regions. Asia, exclud-
ing Japan and China, accounted for approximately 10 percent
of total annual production, with approximately 60 percent
destined for Japan, the U.S. and Europe. The Americas and
Europe together accounted for the remaining balance of
approximately 25 percent of total annual production, most of
which was destined for local distribution and sale.
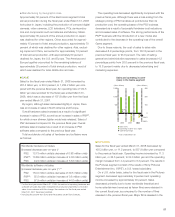
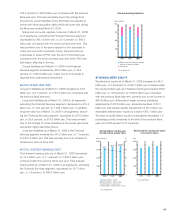
■ GAME
Sales for the fiscal year ended March 31, 2008 increased by
267.5 billion yen, or 26.3 percent, to 1,284.2 billion yen com-
pared with the previous fiscal year. An operating loss of 124.5
billion yen was recorded for the fiscal year ended March 31,
2008, which was a decrease of 107.8 billion yen from the fiscal
year ended March 31, 2007.
By region, although sales decreased slightly in Japan, there
was an increase in sales in North America and Europe.
Overall hardware sales increased as a result of a significant
increase in sales of PS3, as well as an increase in sales of PSP®,
for which a new slimmer, lighter model was released. Sales of
PS2 decreased compared to the previous fiscal year. Overall
software sales increased as a result of an increase in PS3
software sales compared to the previous fiscal year.
Total worldwide unit sales of hardware and software were
as follows:
Worldwide hardware unit sales
(increase/decrease year-on-year ):*
PS2: 13.73 million units (a decrease of 0.98 million units)
PSP®: 13.89 million units (an increase of 4.36 million units)
PS3: 9.24 million units (an increase of 5.63 million units)
Worldwide software unit sales
(increase/decrease year-on-year ):*/**
PS2: 154.0 million units (a decrease of 39.5 million units)
PSP®: 55.5 million units (an increase of 0.8 million units)
PS3: 57.9 million units (an increase of 44.6 million units)
* For the fiscal year ended March 31, 2008, the method of reporting hardware and
software unit sales has been changed from production shipments to recorded
sales. In accordance with this change, the numbers for the fiscal year ended
March 31, 2007 have been restated.
** Including those both from Sony and third parties under Sony licenses.
(Yen in billions)
Sales and operating income
(loss) in the Game segment
■¥Sales (left)
■¥Operating income (loss) (right)
●¥Operating margin
* Years ended March 31
1,500
1,000
500
0
300
200
100
0
–232.3
2006 2007 2008
0.9%
–124.5
(Yen in billions)