Sony 2008 Annual Report Download - page 63
Download and view the complete annual report
Please find page 63 of the 2008 Sony annual report below. You can navigate through the pages in the report by either clicking on the pages listed below, or by using the keyword search tool below to find specific information within the annual report.-
 1
1 -
2
-
3
-
4
-
5
-
6
-
7
-
8
-
9
-
10
-
11
-
12
-
13
-
14
-
15
-
16
-
17
-
18
-
19
-
20
-
21
-
22
-
23
-
24
-
25
-
26
-
27
-
28
-
29
-
30
-
31
-
32
-
33
-
34
-
35
-
36
-
37
-
38
-
39
-
40
-
41
-
42
-
43
-
44
-
45
-
46
-
47
-
48
-
49
-
50
-
51
-
52
-
 53
53 -
 54
54 -
 55
55 -
 56
56 -
 57
57 -
 58
58 -
 59
59 -
 60
60 -
 61
61 -
 62
62 -
 63
63 -
 64
64 -
 65
65 -
 66
66 -
 67
67 -
 68
68 -
 69
69 -
 70
70 -
 71
71 -
 72
72 -
 73
73 -
74
-
75
-
76
-
77
-
78
-
79
-
80
-
81
-
82
-
83
-
84
-
85
-
86
-
87
-
88
-
89
-
90
-
91
-
92
-
93
-
94
-
95
-
96
-
97
-
98
-
99
-
100
-
101
-
102
-
103
-
104
-
105
-
106
 |
 |
61
month before the actual transactions take place when business
requirements such as shorter production-sales cycles for
certain products arise. Sony enters into foreign exchange
transactions with financial institutions primarily for hedging
purposes. Sony does not use these derivative financial instru-
ments for trading or speculative purposes except for certain
derivatives in the Financial Services segment. In the Financial
Services segment, Sony uses derivatives for Asset Liability
Management (“ALM”), a method of managing interest rate
fluctuation risk through the comprehensive identification of
differences in duration and cash flow between assets and
liabilities, and trading.
To minimize the adverse effects of foreign exchange fluctua-
tions on its financial results, particularly in the Electronics
segment, Sony seeks, when appropriate, to localize material
and parts procurement, design, and manufacturing operations
in areas outside of Japan.
Changes in the fair value of derivatives designated as cash
flow hedges are initially recorded in other comprehensive
income and reclassified into earnings when the hedged trans-
action affects earnings. For the fiscal years ended March 31,
2007 and 2008, these cash flow hedges were fully effective.
Foreign exchange forward contracts, foreign currency option
contracts and other derivatives that do not qualify as hedges
are marked-to-market with changes in value recognized in
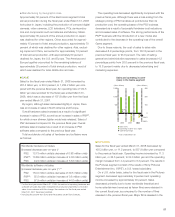
Other Income and Expenses. The notional amounts of foreign
exchange forward contracts, currency option contracts pur-
chased and currency option contracts written as of March 31,
2008 were 2,019.8 billion yen, 215.7 billion yen and 25.9 billion
yen, respectively.
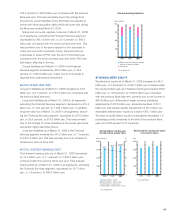
ASSETS, LIABILITIES AND STOCKHOLDERS’
EQUITY
ASSETS
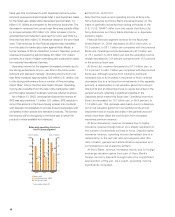
Total assets as of March 31, 2008 increased by 836.4 billion
yen, or 7.1 percent, to 12,552.7 billion yen compared with the
previous fiscal year-end. Total assets as of March 31, 2008 in all
segments excluding the Financial Services segment increased
by 86.9 billion yen, or 1.2 percent, to 7,185.0 billion yen com-
pared with the previous fiscal year-end. Total assets as of March
31, 2008 in the Financial Services segment increased by 648.0
billion yen, or 13.0 percent, to 5,625.7 billion yen compared with
the previous fiscal year-end.
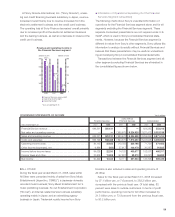
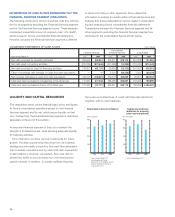
■ CURRENT ASSETS
Current assets as of March 31, 2008 increased by 462.9
billion yen, or 10.2 percent, to 5,009.7 billion yen compared
with the previous fiscal year-end. Current assets as of March
31, 2008 in all segments, excluding the Financial Services
segment, increased by 341.7 billion yen, or 9.8 percent, to
3,836.7 billion yen.
Cash and cash equivalents as of March 31, 2008 in all
segments, excluding the Financial Services segment, increased
425.9 billion yen, or 81.4 percent, to 948.7 billion yen compared
with the previous fiscal year-end. This was primarily due to the
sale of a portion of the shares Sony Corporation held in SFH
pursuant to the global initial public offering of SFH in connection
with its listing on the TSE. Refer to “Cash Flows.”
Notes and accounts receivable, trade (net of allowance for
doubtful accounts and sales returns) as of March 31, 2008,
excluding the Financial Services segment, decreased 259.6
billion yen, or 19.3 percent, compared with the previous fiscal
year-end to 1,083.5 billion yen. This was primarily the result of a
decrease in sales of PS3 near the end of the fiscal year com-
pared with the previous fiscal year-end when PS3 had just
begun shipping in Europe.
Inventories as of March 31, 2008 increased by 80.7 billion
yen, or 8.6 percent, to 1,021.6 billion yen compared with the
previous fiscal year-end. This increase was primarily due to an
increase in Electronics segment inventory resulting from a
worldwide expansion of the LCD television business. The
inventory to cost of sales turnover ratio (based on the average
of inventories at the end of each fiscal year and the previous
fiscal year) was 1.87 months compared to 1.78 months at the
end of the previous fiscal year. Sony considers this level of
inventory to be appropriate in the aggregate.
Other in current assets as of March 31, 2008 in all seg-
ments, excluding the Financial Services segment, increased
175.6 billion yen, or 10.8 percent, to 1,801.5 billion yen
compared with the previous fiscal year-end. This was primar-
ily due to the recording of a receivable within the Electronics
segment relating to the sale of a portion of Sony’s semicon-
ductor operations in Nagasaki, Japan, including machinery
and equipment.
Current assets as of March 31, 2008 in the Financial
Services segment increased by 115.9 billion yen, or 10.6
percent, to 1,205.1 billion yen compared with the previous
fiscal year-end. This increase was primarily due to an
expansion of banking businesses.