Sony 2008 Annual Report Download - page 72
Download and view the complete annual report
Please find page 72 of the 2008 Sony annual report below. You can navigate through the pages in the report by either clicking on the pages listed below, or by using the keyword search tool below to find specific information within the annual report.-
 1
1 -
2
-
3
-
4
-
5
-
6
-
7
-
8
-
9
-
10
-
11
-
12
-
13
-
14
-
15
-
16
-
17
-
18
-
19
-
20
-
21
-
22
-
23
-
24
-
25
-
26
-
27
-
28
-
29
-
30
-
31
-
32
-
33
-
34
-
35
-
36
-
37
-
38
-
39
-
40
-
41
-
42
-
43
-
44
-
45
-
46
-
47
-
48
-
49
-
50
-
51
-
52
-
53
-
54
-
55
-
56
-
57
-
58
-
59
-
60
-
61
-
 62
62 -
 63
63 -
 64
64 -
 65
65 -
 66
66 -
 67
67 -
 68
68 -
 69
69 -
 70
70 -
 71
71 -
 72
72 -
 73
73 -
 74
74 -
 75
75 -
 76
76 -
 77
77 -
 78
78 -
 79
79 -
 80
80 -
 81
81 -
 82
82 -
83
-
84
-
85
-
86
-
87
-
88
-
89
-
90
-
91
-
92
-
93
-
94
-
95
-
96
-
97
-
98
-
99
-
100
-
101
-
102
-
103
-
104
-
105
-
106
 |
 |

70
in nature from Sony’s other segments, Sony utilizes this
information to analyze its results without Financial Services and
believes that these presentations may be useful in understand-
ing and analyzing Sony’s consolidated financial statements.
Transactions between the Financial Services segment and all
other segments excluding the Financial Services segment are
eliminated in the consolidated figures shown below.
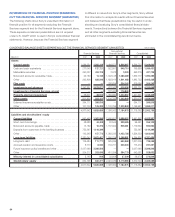
CONDENSED STATEMENTS OF CASH FLOWS
Yen in millions
Sony without
Financial Services Financial Services Consolidated
Years ended March 31 2007 2008 2007 2008 2007 2008
Net cash provided by operating activities ..................
256,540 242,610 305,571 519,112
561,028 757,684
Net cash used in investing activities .......................
(276,749) (873,646)
(431,086)
(14,925)
(715,430) (910,442)
Net cash provided by (used in) financing activities ............
179,627 491,709
59,598
(12,100)
247,903 505,518
Effect of exchange rate changes on cash and cash equivalents . .
— —
3,300
(66,228)
3,300 (66,228)
Net increase (decrease) in cash and cash equivalents .........
159,418 (139,327) (62,617) 425,859 96,801 286,532
Cash and cash equivalents at beginning of the fiscal year ......
117,630 277,048
585,468
522,851
703,098 799,899
Cash and cash equivalents at end of the fiscal year ...........
277,048 137,721
522,851
948,710
799,899 1,086,431
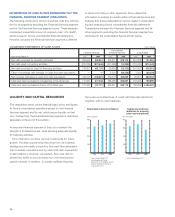
INFORMATION OF CASH FLOWS SEPARATING OUT THE
FINANCIAL SERVICES SEGMENT (UNAUDITED)
The following charts show Sony’s unaudited cash flow informa-
tion for all segments excluding the Financial Services segment
and for the Financial Services segment alone. These separate
condensed presentations are not required under U.S. GAAP,
which is used in Sony’s consolidated financial statements.
However, because the Financial Services segment is different
LIQUIDITY AND CAPITAL RESOURCES
(The description below covers financial basic policy and figures
for Sony’s consolidated operations except for the Financial
Services segment and So-net, which secure liquidity on their
own. Furthermore, the Financial Services segment is described
separately at the end of this section.)
An important financial objective of Sony is to maintain the
strength of its balance sheet, while securing adequate liquidity
for business activities.
Sony intends to continue various investments for future
growth. Funding requirements that arise from its business
strategy are principally covered by free cash flow generated
from business operations and by cash and cash equivalents
(“cash balance”); however, as needed, Sony has demon-
strated the ability to procure funds from the financial and
capital markets. In addition, to sustain sufficient liquidity,
Sony has committed lines of credit with financial institutions,
together with its cash balances.
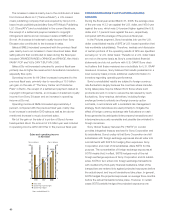
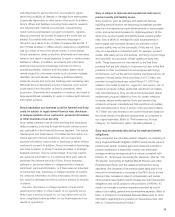
(Yen in billions)
Depreciation and amortization
* Years ended March 31
* Including amortization
expenses for intangible assets
and for deferred insurance
acquisition costs
480
360
240
120
02006 2007 2008
Capital expenditures
(additions to property,
plant and equipment)
* Years ended March 31
(Yen in billions)
480
360
240
120
02006 2007 2008