Sony 2008 Annual Report Download - page 67
Download and view the complete annual report
Please find page 67 of the 2008 Sony annual report below. You can navigate through the pages in the report by either clicking on the pages listed below, or by using the keyword search tool below to find specific information within the annual report.-
 1
1 -
2
-
3
-
4
-
5
-
6
-
7
-
8
-
9
-
10
-
11
-
12
-
13
-
14
-
15
-
16
-
17
-
18
-
19
-
20
-
21
-
22
-
23
-
24
-
25
-
26
-
27
-
28
-
29
-
30
-
31
-
32
-
33
-
34
-
35
-
36
-
37
-
38
-
39
-
40
-
41
-
42
-
43
-
44
-
45
-
46
-
47
-
48
-
49
-
50
-
51
-
52
-
53
-
54
-
55
-
56
-
 57
57 -
 58
58 -
 59
59 -
 60
60 -
 61
61 -
 62
62 -
 63
63 -
 64
64 -
 65
65 -
 66
66 -
 67
67 -
 68
68 -
 69
69 -
 70
70 -
 71
71 -
 72
72 -
 73
73 -
 74
74 -
 75
75 -
 76
76 -
 77
77 -
78
-
79
-
80
-
81
-
82
-
83
-
84
-
85
-
86
-
87
-
88
-
89
-
90
-
91
-
92
-
93
-
94
-
95
-
96
-
97
-
98
-
99
-
100
-
101
-
102
-
103
-
104
-
105
-
106
 |
 |

65
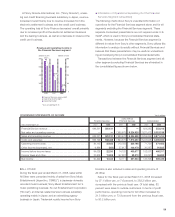
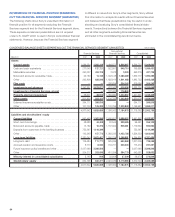
The following table contains available-for-sale and held to maturity securities, breaking out the unrealized gains and losses by
investment category.
Yen in millions
Unrealized Unrealized Fair market
March 31, 2008 Cost gain loss value
Financial Services Business:
Available for sale
Debt securities
Sony Life ...........................................................
2,564,845 77,456 (2,644) 2,639,657
Other .............................................................
481,159 998 (10,412) 471,745
Equity securities
Sony Life ...........................................................
181,256 47,557 (14,513) 214,300
Other .............................................................
11,452 1,036 (1,504) 10,984
Held to maturity
Debt securities
Sony Life ...........................................................
— — — —
Other .............................................................
56,737 773 (34) 57,476
Total Financial Services ................................................
3,295,449 127,820 (29,107) 3,394,162
Non-Financial Services:
Available-for-sale securities ................................................
52,935 26,992 (3,574) 76,353
Held to maturity securities .................................................
1,103 — — 1,103
Total Non-Financial Services ............................................
54,038 26,992 (3,574) 77,456
Consolidated ...........................................................
3,349,487 154,812 (32,681) 3,471,618
The most significant portion of these unrealized losses relate to
investments held by Sony Life and Sony Bank.
As of March 31, 2008, Sony Life had debt and equity
securities which had gross unrealized losses of 2.6 billion yen
and 14.5 billion yen, respectively. Of the unrealized loss amounts
recorded by Sony Life, approximately 1.5 percent relate to
securities being in an unrealized loss position for periods greater
than 12 months as of March 31, 2008. Sony Life principally
invests in debt securities in various industries. Almost all of these
securities were rated “BBB” or higher by Standard and Poor’s
Rating Services (“S&P”), Moody’s Investors Service (“Moody’s”)
or other rating agencies. The percentage of non-investment
grade securities held by Sony Life represents approximately
0.2 percent of Sony Life’s total investment portfolio, while the
percentage of unrealized losses that relate to those non-
investment grade securities was 0.7 percent of Sony Life’s
total unrealized losses as of March 31, 2008.
As of March 31, 2008, Sony Bank had debt securities which
had gross unrealized losses of 10.4 billion yen. Of the unrealized
loss amounts recorded by Sony Bank, approximately 60.2
percent relate to securities being in an unrealized loss position for
periods greater than 12 months as of March 31, 2008. These
unrealized losses related principally to Japanese government
bonds. Sony Bank principally invests in Japanese national
government bonds, Japanese corporate bonds and foreign
bonds. Almost all of these securities were rated “BBB” or higher
by S&P, Moody’s or other rating agencies. These unrealized
losses related to numerous investments, with no single invest-
ment being in a material unrealized loss position for above-
mentioned periods. In addition, there was no individual security
with unrealized losses that met the test for impairment as the
declines in value were observed to be small both in amounts
and percentage, and therefore, the decline in value for those
investments was still determined to be temporary in nature.
INVESTMENTS