Sony 2008 Annual Report Download - page 65
Download and view the complete annual report
Please find page 65 of the 2008 Sony annual report below. You can navigate through the pages in the report by either clicking on the pages listed below, or by using the keyword search tool below to find specific information within the annual report.-
 1
1 -
2
-
3
-
4
-
5
-
6
-
7
-
8
-
9
-
10
-
11
-
12
-
13
-
14
-
15
-
16
-
17
-
18
-
19
-
20
-
21
-
22
-
23
-
24
-
25
-
26
-
27
-
28
-
29
-
30
-
31
-
32
-
33
-
34
-
35
-
36
-
37
-
38
-
39
-
40
-
41
-
42
-
43
-
44
-
45
-
46
-
47
-
48
-
49
-
50
-
51
-
52
-
53
-
54
-
 55
55 -
 56
56 -
 57
57 -
 58
58 -
 59
59 -
 60
60 -
 61
61 -
 62
62 -
 63
63 -
 64
64 -
 65
65 -
 66
66 -
 67
67 -
 68
68 -
 69
69 -
 70
70 -
 71
71 -
 72
72 -
 73
73 -
 74
74 -
 75
75 -
76
-
77
-
78
-
79
-
80
-
81
-
82
-
83
-
84
-
85
-
86
-
87
-
88
-
89
-
90
-
91
-
92
-
93
-
94
-
95
-
96
-
97
-
98
-
99
-
100
-
101
-
102
-
103
-
104
-
105
-
106
 |
 |

63
319.4 percent, to 339.5 billion yen compared with the previous
fiscal year-end. This was principally due to the change from
long-term to current liabilities of the 250 billion yen tranche of
bonds with stock acquisition rights which will come due during
the fiscal year ending March 31, 2009.
Notes and accounts payable, trade as of March 31, 2008
in all segments, excluding the Financial Services segment,
decreased by 261.0 billion yen, or 22.4 percent, to 906.3
billion yen compared with the previous fiscal year-end. This
was primarily due to the same reason for the decrease in
notes and accounts receivable, trade, discussed above:
a decrease in sales of PS3 near the end of the fiscal year
compared with the previous fiscal year-end when PS3 had
just begun shipping in Europe.
Current liabilities as of March 31, 2008 in the Financial
Services segment increased by 405.5 billion yen, or 42.4
percent, to 1,363.0 billion yen, mainly due to an increase in
deposits from customers at Sony Bank.
■ LONG-TERM LIABILITIES
Long-term liabilities as of March 31, 2008 increased by 32.6
billion yen, or 0.7 percent, to 4,787.4 billion yen compared with
the previous fiscal year-end.
Long-term liabilities as of March 31, 2008 in all segments,
excluding the Financial Services segment, decreased by 231.4
billion yen, or 15.4 percent, to 1,269.0 billion yen. In addition,
long-term debt as of March 31, 2008 in all segments, exclud-
ing the Financial Services segment, decreased by 274.3 billion
yen, or 29.6 percent, to 651.0 billion yen. This was primarily
due to the change to current liabilities of the bonds with stock
acquisition rights described above.
Long-term liabilities as of March 31, 2008 in the Financial
Services segment increased by 241.2 billion yen, or 7.1 percent,
to 3,621.4 billion yen. This was primarily due to an increase in
insurance-in-force at Sony Life.
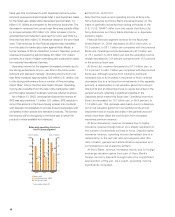
■ TOTAL INTEREST-BEARING DEBT
Total interest-bearing debt as of March 31, 2008 decreased
by 12.3 billion yen, or 1.1 percent, to 1,084.2 billion yen,
compared with the previous fiscal year-end. Total interest-
bearing debt as of March 31, 2008 in all segments, excluding
the Financial Services segment, decreased by 15.7 billion
yen, or 1.6 percent, to 990.5 billion yen.
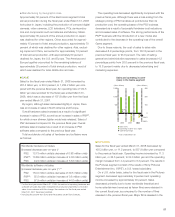
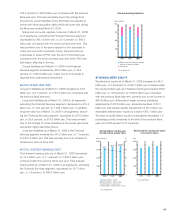
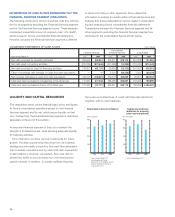
STOCKHOLDERS’ EQUITY
Stockholders’ equity as of March 31, 2008 increased by 94.4
billion yen, or 2.8 percent, to 3,465.1 billion yen compared with
the previous fiscal year-end. Retained earnings increased 339.9
billion yen, or 19.8 percent, to 2,059.4 billion yen compared
with the previous fiscal year-end, primarily due to net income of
369.4 billion yen. Unfavorable foreign currency translation
adjustments of 212.5 billion yen, dividends declared of 25.1
billion yen and pension liability adjustments of 26.1 billion yen
decreased shareholders’ equity by a total of 263.7 billion yen.
The ratio of stockholders’ equity to total assets decreased 1.2
percentage points compared to the end of the previous fiscal
year, from 28.8 percent to 27.6 percent.
Interest-bearing liabilities
1,200
900
600
300
02006 2007 2008
(Yen in billions)
■¥Short-term (including the current
portion of long-term debt)
■¥Long-term
* As of March 31
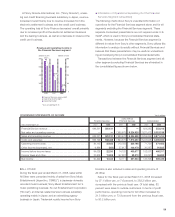
(Yen)
Stockholders’ equity per share
of common stock
* As of March 31
4,000
3,000
2,000
1,000
02006 2007 2008
(Yen in billions)
Stockholders’ equity and
stockholders’ equity ratio
■¥Stockholders’ equity
●¥Stockholders’ equity ratio
Stockholders’ equity ratio =
Stockholders’ equity/Total assets
* As of March 31
(%)
40
30
20
10
0
4,000
3,000
2,000
1,000
02006 2007 2008
30.2% 28.8% 27.6%