Sony 2008 Annual Report Download - page 60
Download and view the complete annual report
Please find page 60 of the 2008 Sony annual report below. You can navigate through the pages in the report by either clicking on the pages listed below, or by using the keyword search tool below to find specific information within the annual report.-
 1
1 -
2
-
3
-
4
-
5
-
6
-
7
-
8
-
9
-
10
-
11
-
12
-
13
-
14
-
15
-
16
-
17
-
18
-
19
-
20
-
21
-
22
-
23
-
24
-
25
-
26
-
27
-
28
-
29
-
30
-
31
-
32
-
33
-
34
-
35
-
36
-
37
-
38
-
39
-
40
-
41
-
42
-
43
-
44
-
45
-
46
-
47
-
48
-
49
-
 50
50 -
 51
51 -
 52
52 -
 53
53 -
 54
54 -
 55
55 -
 56
56 -
 57
57 -
 58
58 -
 59
59 -
 60
60 -
 61
61 -
 62
62 -
 63
63 -
 64
64 -
 65
65 -
 66
66 -
 67
67 -
 68
68 -
 69
69 -
 70
70 -
71
-
72
-
73
-
74
-
75
-
76
-
77
-
78
-
79
-
80
-
81
-
82
-
83
-
84
-
85
-
86
-
87
-
88
-
89
-
90
-
91
-
92
-
93
-
94
-
95
-
96
-
97
-
98
-
99
-
100
-
101
-
102
-
103
-
104
-
105
-
106
 |
 |

58
fiscal year that contributed to both theatrical and home enter-
tainment revenues included Spider-Man 3 and Superbad. Sales
for the fiscal year release slate decreased approximately 1.2
billion U.S. dollars as compared to the previous fiscal year. The
decrease in revenues from current year films was partially offset
by an approximately 300 million U.S. dollar increase in home
entertainment and television revenues from prior year films (i.e.,
films that had their initial U.S. theatrical release in the prior fiscal
year). Total revenues for the Pictures segment also benefited
from the sale of a bankruptcy claim against Kirch Media, a
former licensee of film and television product. Television product
revenues increased by approximately 29 million U.S. dollars
primarily as a result of higher advertising and subscription sales
from several international channels.
Operating income for the segment increased primarily due to
the strong performance of prior year films in the home enter-
tainment and television markets. Operating income from prior
year films increased approximately 225 million U.S. dollars, due
to the strong performance from a number of films including
Ghost Rider, Stomp the Yard and Casino Royale. Operating
income also benefited from the sale of the bankruptcy claim
and the higher television business revenues referred to above.
As of March 31, 2008, unrecognized license fee revenue at
SPE was approximately 1.3 billion U.S. dollars. SPE expects to
record this amount in the future having entered into contracts
with television broadcasters to provide those broadcasters with
completed motion picture and television products. The license
fee revenue will be recognized in the fiscal year in which the
product is made available for broadcast.
■ FINANCIAL SERVICES
Note that the revenue and operating income at Sony Life,
Sony Assurance and Sony Bank discussed below on the
basis of generally accepted accounting principles in the
U.S. (“U.S. GAAP”) differ from the results that Sony Life,
Sony Assurance and Sony Bank disclose on a Japanese
statutory basis.
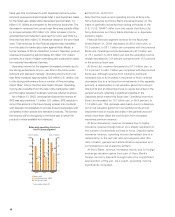
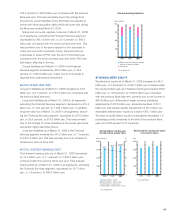
Financial Services segment revenue for the fiscal year
ended March 31, 2008 decreased by 68.2 billion yen, or
10.5 percent, to 581.1 billion yen compared with the previous
fiscal year. Operating income decreased by 61.5 billion yen,
or 73.1 percent, to 22.6 billion yen and the operating income
margin decreased to 3.9 percent compared with 13.0 percent
in the previous fiscal year.
At Sony Life, revenue decreased by 81.0 billion yen, or
14.9 percent, to 464.1 billion yen compared with the previous
fiscal year. Although revenue from insurance premiums
increased due to an increase in insurance-in-force, revenue
decreased due to a net loss from investments in the separate
account, a deterioration in net valuation gains from convert-
ible bonds and an impairment loss on equity securities in the
general account reflecting a significant decline in the
Japanese stock market this fiscal year. Operating income at
Sony Life decreased by 70.1 billion yen, or 85.9 percent, to
11.5 billion yen. This decrease was mainly due to a deteriora-
tion in net valuation gains from convertible bonds and an
impairment loss on equity securities in the general account
which more than offset the contribution from increased
insurance premium revenue.
At Sony Assurance, revenue increased due to higher
insurance revenue brought about by a steady expansion in
the number of automobile policies-in-force. Despite higher
insurance revenue, operating income decreased due to a
deterioration in the net loss ratio and expense ratio (the
ratio of sales, general and administrative expenses and
commissions to net premiums written).
At Sony Bank, revenue increased mainly due to foreign
exchange valuation gains from part of Sony Bank’s
foreign currency deposits brought about by a significant
appreciation of the yen. As a result, operating income
significantly increased.
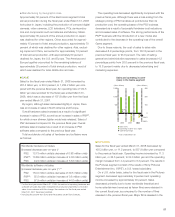
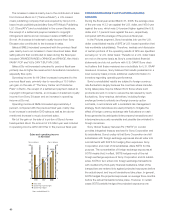
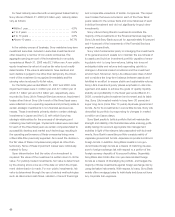
Sales and operating income in
the Pictures segment
■¥Sales (left)
■¥Operating income (right)
●¥Operating margin
* Years ended March 31
1,000
750
500
250
0
100
75
50
25
0
2006 2007 2008
3.7%
4.4%
6.3%
(Yen in billions) (Yen in billions)