Sysco 2012 Annual Report Download
Download and view the complete annual report
Please find the complete 2012 Sysco annual report below. You can navigate through the pages in the report by either clicking on the pages listed below, or by using the keyword search tool below to find specific information within the annual report.-
 1
1 -
 2
2 -
 3
3 -
 4
4 -
 5
5 -
 6
6 -
 7
7 -
 8
8 -
 9
9 -
 10
10 -
 11
11 -
 12
12 -
13
-
14
-
15
-
16
-
17
-
18
-
19
-
20
-
21
-
22
-
23
-
24
-
25
-
26
-
27
-
28
-
29
-
30
-
31
-
32
-
33
-
34
-
35
-
36
-
37
-
38
-
39
-
40
-
41
-
42
-
43
-
44
-
45
-
46
-
47
-
48
-
49
-
50
-
51
-
52
-
53
-
54
-
55
-
56
-
57
-
58
-
59
-
60
-
61
-
62
-
63
-
64
-
65
-
66
-
67
-
68
-
69
-
70
-
71
-
72
-
73
-
74
-
75
-
76
-
77
-
78
-
79
-
80
-
81
-
82
-
83
-
84
-
85
-
86
-
87
-
88
-
89
-
90
-
91
-
92
-
93
-
94
-
95
-
96
-
97
-
98
-
99
-
100
-
101
-
102
-
103
-
104
-
105
-
106
-
107
-
108
-
109
-
110
-
111
 |
 |
TM
Sysco Corporation
2012 Annual Report
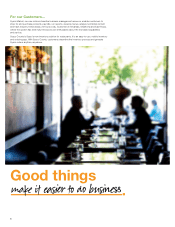
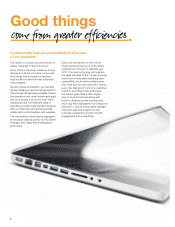
Good things
fi .
• 55,168 lbs of wood
• 80,561 gallons of water
• 56 million BTUs of energy
• 16,727 lbs of emissions
• 4,891 lbs of solid waste
Table of contents
-
Page 1
Good things define us . Sysco Corporation 2012 Annual Report TM -
Page 2
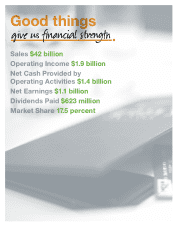
Good things give us financial strength . Sales $42 billion Operating Income $1.9 billion Net Cash Provided by Operating Activities $1.4 billion Net Earnings $1.1 billion Dividends Paid $623 million Market Share 17.5 percent -
Page 3
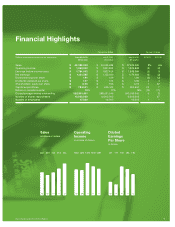
... 2010 (53 weeks) Percent Change 2012-11 2011-10 Sales Operating income Earnings before income taxes Net earnings Diluted earnings per share Dividends declared per share Shareholders' equity per share Capital expenditures Return on invested capital Diluted average shares outstanding Number of shares... -
Page 4
...to work more safely and be more productive on the job. During 2012, we completed the installation of Sysco Transportation System, or STS. This new technology scans each case as it is delivered to customers, improving customer service, reducing errors and making deliveries more efficient. • Expand... -
Page 5
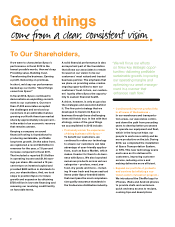
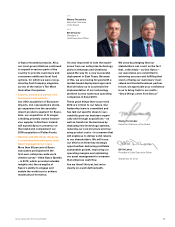
... valued and trusted business partner. In turn, we appreciate your confidence in us to bring truth to our motto: "Good things come from Sysco. " Manny Fernandez Executive Chairman of the Board Bill DeLaney President & Chief Executive Officer September 27, 2012 Sysco Corporation 2012 Annual Report... -
Page 6
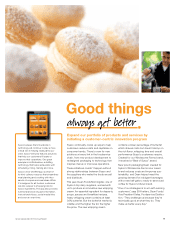
... Market, our new online interactive business management resource, enables customers to shop for and purchase products, pay bills, run reports, develop menus, analyze nutritional content and track industry trends easily, 24 hours a day. Customers in Arkansas, Oklahoma and east texas, where the system... -
Page 7
... very good at helping me buy value over price, " Bennett says. "I'm in contact with my market associate daily and also rely on a team of local Sysco professionals who can help with any aspect of my business, from technology support to nutritional questions. " Sysco Corporation 2012 Annual Report 5 -
Page 8
...customers, the system gives MAs a 360-degree view of account histories along with tools for developing new business and improving time management and resource allocation. It also provides sales management with real-time insight into new business, penetration growth and MA engagement and productivity... -
Page 9
... models of efficiency, each operating company is participating in a major initiative to standardize best practices across the organization. In fiscal 2012, we completed the installation of Sysco transportation System, or StS. this new technology scans each case as it is delivered to customers... -
Page 10
8 -
Page 11
... and serving size information, instructional videos, social media links and even an oven timer. Sysco continually cooks up ways to help customers reduce costs and capitalize on consumer trends. there's room for new solutions at every link in the foodservice chain, from new product development to... -
Page 12
Good things lead to other good things. 10 -
Page 13
... fold-ins as well as specialty and international companies - and also pursuing adjacencies that help customers improve their businesses. During fiscal 2012, we enhanced our Broadline operations through the completion of nine acquisitions representing nearly $270 million in annualized sales. In doing... -
Page 14
... workforce of marketing associates and district sales managers. Sysco Speaks, our first enterprise-wide employee engagement survey, garnered an exceptional 80% response rate, tangibly demonstrating the high levels of pride and passion Sysco employees feel for their company's brand - as well as their... -
Page 15
Sysco Corporation 2012 Annual Report 13 -
Page 16
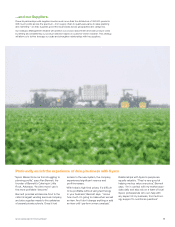
... for our customers. Our specialty produce companies address customers' needs for fresh, unique and local produce items. european Imports, acquired in fiscal 2012, provides customers with high-quality, specialty and imported food products. Our Guest Supply company distributes equipment, textiles... -
Page 17
... Per Share in dollars Net Earnings in millions of dollars Net Cash from Operations in millions of dollars 0.85 0.94 0.99 1.03 1.07 1,106 1,056 1,180 1,152 1,122 1,570 1,577 885 1,092 1,404 08 09 10 11 12 08 09 10 11 12 08 09 10 11 12 Sysco Corporation 2012 Annual Report 15 -
Page 18
... President, foodservice Operations (South) Twila M. Day Senior Vice President and Chief Information Officer William B. Day executive Vice President, Merchandising and Supply Chain William J. DeLaney President and Chief executive Officer Kirk G. Drummond Senior Vice President, Sysco Business Services... -
Page 19
Financials -
Page 20
...) Financial Position Current ratio Working capital Other assets Plant and equipment (net) Total assets Long-term debt Shareholders' equity Other Data Dividends declared Capital expenditures Number of employees Shareholder Data Closing price of common share at year end Price/earnings ratio at year... -
Page 21
...) 1,525,436 563,979 2004 (53 Weeks) $ 29,335,403 23,560,318 ...Year Growth Rate 2012 8% 5-Year Compound Growth Rates 2008-2012 4% 10-Year Compound Growth Rates 2003-2012 6% 20-Year Compound Growth Rates 1993-2012...(0) 7 8 8 $ $ $ $ $ $ $ $ $ $ $ $ $ $ $ SYSCO CORPORATION - Form 10-K 19 -
Page 22
... Texas 77077-2099 (Address of principal executive ofï¬ces) (Zip Code) (281) 584-1390 (Registrant's telephone number, including area code) SECURITIES REGISTERED PURSUANT TO SECTION 12(b) OF THE ACT: Title of Each Class Common Stock, $1.00 par value Name of each exchange on which registered New York... -
Page 23
... Data...41 Changes in and Disagreements with Accountants on Accounting and Financial Disclosure ...83 Controls and Procedures...83 Other Information...83 PART III ITEM 10 ITEM 11 ITEM 12 ITEM 13 ITEM 14 84 Directors, Executive Of cers and Corporate Governance...84 Executive Compensation... -
Page 24
... to chain restaurant customer locations. Our other segments include our specialty produce and lodging industry products segments, a company that distributes specialty imported products and a company that distributes to international customers. Specialty produce companies distribute fresh produce and... -
Page 25
... data, menu-planning advice, food safety training and assistance in inventory control, as well as access to various third party services designed to add value to our customers' businesses. No single customer accounted for 10% or more of Sysco's total sales for the ï¬scal year ended June 30, 2012... -
Page 26
... and distribution services, which provide assistance in operational best practices including space utilization, energy conservation, ï¬,eet management and work ï¬,ow. Our shared services center performs support services for employees, suppliers and customers, payroll administration, human resources... -
Page 27
...industry are effective customer contacts, the ability to deliver a wide range of quality products and related services on a timely and dependable basis and competitive prices. An additional competitive factor for our larger chain restaurant customers is the ability to provide a national distribution... -
Page 28
...development activities relating to the development of new products or the improvement of existing products. Our sales do not generally ï¬,uctuate signiï¬cantly on a seasonal basis; therefore, the business of the company is not deemed to be seasonal. As of June 30, 2012, we operated 185 distribution... -
Page 29
... our market share, growth rate and proï¬tability The foodservice distribution industry is highly competitive, with numerous regional and local competitors, and is a mature industry characterized by slowing revenue growth. Additionally, new competition could arise from non-traditional sources, group... -
Page 30
... a number of cost reduction initiatives that we believe are necessary to position our business for future success and growth. Our future success and earnings growth depend upon our ability to achieve a lower cost structure and operate efï¬ciently in the highly competitive food and beverage industry... -
Page 31
...and difï¬culties of managing operations outside of our core business, which may require additional skills and competencies, as well as difï¬culties in identifying and gaining access to suppliers or customers in new markets. If we fail to comply with requirements imposed by applicable law or other... -
Page 32
... impact our customer service, decrease the volume of our business and result in increased costs. Furthermore, process changes will be required as we continue to use our existing warehousing, delivery, and payroll systems to support operations as we implement the ERP system. While Sysco has invested... -
Page 33
... our business and materially reduce earnings Our operations rely heavily on our employees, particularly drivers, and any shortage of qualiï¬ed labor could signiï¬cantly affect our business. Our recruiting and retention efforts and efforts to increase productivity gains may not be successful and... -
Page 34
... Michigan Minnesota Mississippi Missouri Montana Nebraska Nevada New Jersey New Mexico New York North Carolina North Dakota Ohio Oklahoma Oregon Pennsylvania Rhode Island South Carolina Tennessee Texas Utah Virginia Washington Wisconsin Alberta, Canada British Columbia, Canada Manitoba, Canada New... -
Page 35
... June 30, 2012. Such industrial revenue bond ï¬nancing arrangements mature at various dates through ï¬scal 2026. We own our approximately 625,000 square foot headquarters ofï¬ce complex in Houston, Texas. In addition, we own our approximately 669,000 square foot shared services complex in Cypress... -
Page 36
...27 The principal market for Sysco's common stock (SYY) is the New York Stock Exchange. The table below sets forth the high and low sales prices per share for our common stock as reported on the New York Stock Exchange Composite Tape and the cash dividends declared for the periods indicated. Fiscal... -
Page 37
... 500 Food/Staple Retail Index for Sysco's last ï¬ve ï¬scal years. The graph assumes that the value of the investment in our Common Stock, the S&P 500 Index, and the S&P 500 Food/Staple Index was $100 on the last trading day of ï¬scal 2007, and that all dividends were reinvested. Performance data... -
Page 38
... include our custom-cut meat operations), SYGMA (our chain restaurant distribution subsidiary), specialty produce companies, hotel supply operations, a company that distributes specialty imported products and a company that distributes to international customers. We consider our primary market to be... -
Page 39
...Management's Discussion and Analysis of Financial Condition and Results of Operations Highlights High levels of product costs and an uneven economic recovery contributed to a challenging business environment in ï¬scal 2012. Our case volume growth has shown modest improvement in a low growth market... -
Page 40
... Sysco brand products; the suite of services we provide to our customers such as business reviews and menu analysis; and our wide geographic presence in the United States and Canada. In addition, we have a portfolio of businesses spanning broadline, specialty meat, chain restaurant distribution... -
Page 41
... $0.8 million in fiscal 2010. Sales Sales for ï¬scal 2012 were 7.8% higher than ï¬scal 2011. Sales for ï¬scal 2012 increased as a result of product cost inï¬,ation, and the resulting increase in selling prices, along with improving case volumes. Changes in product cost, an internal measure of in... -
Page 42
... in net company-sponsored pension costs and lower provisions related to multiemployer pension plans. Adjusted operating expenses increased 4.1%, or $221.0 million, in ï¬scal 2012 over ï¬scal 2011. Pay-related expenses, excluding labor costs associated with our Business Transformation Project... -
Page 43
... signiï¬cant year-over-year impact from COLI adjustments as compared to ï¬scal 2013. Net company-sponsored pension costs in ï¬scal 2012 were $27.3 million lower than in ï¬scal 2011. The decrease in ï¬scal 2012 was due primarily to higher returns on assets of Sysco's Retirement Plan obtained in... -
Page 44
...entire fourth quarter. Operating expenses for ï¬scal 2011 increased 4.8% primarily due to higher pay-related expense, an increase in net company-sponsored pension costs, provisions for withdrawal from multiemployer pension plans and higher fuel costs as compared to the prior year period. The impact... -
Page 45
... earnings per share in future periods related to these policies. We experienced signiï¬cant gains in these policies during ï¬scal 2011. Management believes that adjusting its operating expenses, operating income, net earnings and diluted earnings per share to remove the impact of the Business... -
Page 46
..., multiemployer pension plan expenses, restructuring charges was $82.2 million and $53.3 million for fiscal 2012 and 2011, respectively. (2) Individual components of diluted earnings per share may not sum to the total adjusted diluted earnings due to rounding. SYSCO CORPORATION - Form 10-K 23 -
Page 47
... period reported and should be read in conjunction with Note 21, "Business Segment Information" to the Consolidated Financial Statements in Item 8: Operating Income as a Percentage of Sales 2010 2012 2011 (53 Weeks) 7.0% 7.3% 7.7% 1.1 1.2 1.0 3.8 4.5 4.1 Broadline SYGMA Other 24 SYSCO CORPORATION... -
Page 48
...of its sales force, geographic reach of its distribution area and its purchasing power allow us to beneï¬t from this segment's earnings. Sales Sales for ï¬scal 2012 were 7.8% greater than ï¬scal 2011. Product cost inï¬,ation and the resulting increase in selling prices, combined with case volume... -
Page 49
... gross proï¬t dollars and case volumes will increase sales and delivery compensation. However, the impact of our productivity related initiatives could favorably impact the magnitude of this trend. Fuel costs were $26.5 million higher in ï¬scal 2012 than the prior year. Assuming that fuel prices... -
Page 50
... for reduced margins. These operations service chain restaurants through contractual agreements that are typically structured on a fee per case delivered basis. Sales Sales were 7.4% greater in ï¬scal 2012 than in ï¬scal 2011. The increase in sales was primarily due to product cost inï¬,ation... -
Page 51
... from operations is generally allocated to: • working capital requirements; • investments in facilities, systems, ï¬,eet, other equipment and technology; • cash dividends; • acquisitions compatible with our overall growth strategy; • contributions to our various retirement plans; and... -
Page 52
... and inventory balances in ï¬scal 2011. The increase in accounts payable balances in ï¬scal 2011 and ï¬scal 2010 was primarily from the growth in inventory resulting from sales growth. Investing Activities Fiscal 2012 capital expenditures included: • replacement or signiï¬cant expansion of... -
Page 53
... foodservice operations in Sacramento, California; Quebec, Canada; New Haven, Connecticut; Grand Rapids, Michigan; Minneapolis, Minnesota; Columbia, South Carolina and Spokane, Washington. In addition, Sysco acquired for cash a company that distributes specialty imported products headquartered in... -
Page 54
... ITEM 7 Management's Discussion and Analysis of Financial Condition and Results of Operations In November 2000, we ï¬led with the SEC a shelf registration statement covering 30,000,000 shares of common stock to be offered from time to time in connection with acquisitions. As of August 15, 2012, 29... -
Page 55
...Proceeds from the notes will be utilized over a period of time for general corporate purposes, which may include acquisitions, reï¬nancing of debt, working capital, share repurchases and capital expenditures. Total Debt Total debt as of June 30, 2012 was $3.0 billion of which approximately 84% was... -
Page 56
... Financial Statements in Item 8), fixed electricity agreements and fixed fuel purchase commitments. Purchase obligations exclude full requirements electricity contracts where no stated minimum purchase volume is required. Certain acquisitions involve contingent consideration, typically payable... -
Page 57
... of return for ï¬scal 2013 would decrease (increase) Sysco's net company-sponsored pension costs for ï¬scal 2013 by approximately $22.1 million. Pension accounting standards require the recognition of the funded status of our deï¬ned beneï¬t plans in the statement of ï¬nancial position, with... -
Page 58
...timing and amount of contributions decreased net company-sponsored pension costs by $27.3 million in ï¬scal 2012. At the end of ï¬scal 2012, Sysco decided to freeze future beneï¬t accruals under the Retirement Plan as of December 31, 2012 for all U.S.-based salaried and non-union hourly employees... -
Page 59
... if the estimated fair value for any of these reporting units had declined by greater than 50%. Certain reporting units (European Broadline, specialty produce, custom-cut meat, lodging industry products, imported specialty products and international distribution operations) have a greater proportion... -
Page 60
... of shares repurchased in a given period is subject to a number of factors, including available cash and our general working capital needs at the time. Meeting our dividend target objectives depends on our level of earnings. Our plans with respect to growth in international markets and adjacent... -
Page 61
...borrowing cost. These transactions were designated as fair value hedges since the swaps hedge against the changes in fair value of ï¬xed rate debt resulting from changes in interest rates. As of June 30, 2012, the ï¬scal 2013 swap was recognized as an asset within the consolidated balance sheet at... -
Page 62
... debt through interest rate swap agreements. (In thousands) 2012 2013 Interest Rate Position as of July 2, 2011 Notional Amount by Expected Maturity Average Interest Swap Rate 2014 2015 2016 Thereafter Total Fair Value Interest Rate Swaps Related To Debt: Pay Variable/Receive Fixed Average... -
Page 63
...cost of fuel can increase the price we pay for product purchases and we may not be able to pass these costs fully to our customers. Third, increased fuel costs impact the costs we incur to deliver product to our customers. During ï¬scal 2012, 2011 and 2010, fuel costs related to outbound deliveries... -
Page 64
...Accounting Firm on Internal Control Over Financial Reporting ...43 Report of Independent Registered Public Accounting Firm on Consolidated Financial Statements...44 Consolidated Balance Sheets ...45 Consolidated Results of Operations ...46 Consolidated Statements of Comprehensive Income...46 Changes... -
Page 65
... and Supplementary Data Report of Management on Internal Control Over Financial Reporting The management of Sysco Corporation ("Sysco") is responsible for establishing and maintaining adequate internal control over ï¬nancial reporting for the company. Sysco's internal control system is designed to... -
Page 66
...), the consolidated balance sheets of the Company as of June 30, 2012 and July 2, 2011, and the related consolidated results of operations, statements of comprehensive income, shareholders' equity and cash ï¬,ows for each of the three years in the period ended June 30, 2012, of Sysco Corporation and... -
Page 67
... balance sheets of Sysco Corporation (a Delaware Corporation) and subsidiaries (the "Company") as of June 30, 2012 and July 2, 2011, and the related consolidated results of operations, statements of comprehensive income, shareholders' equity, and cash ï¬,ows for each of the three years in the period... -
Page 68
PART II ITEM 8 Financial Statements and Supplementary Data Consolidated Balance Sheets (In thousands except for share data) June 30, 2012 July 2, 2011 ASSETS Current assets Cash and cash equivalents Accounts and notes receivable, less allowances of $42,919 and $42,436 Inventories Deferred income... -
Page 69
... II ITEM 8 Financial Statements and Supplementary Data Consolidated Results of Operations Year Ended (In thousands except for share and per share data) Sales Cost of sales Gross proï¬t Operating expenses Operating income Interest expense Other expense (income), net Earnings before income taxes... -
Page 70
... postretirement beneï¬t plans amounts to net earnings, net of tax Pension funded status adjustment, net of tax Dividends declared Treasury stock purchases Share-based compensation awards BALANCE AS OF JUNE 30, 2012 765,174,900 $ 765,175 $ See Notes to Consolidated Financial Statements 49,973 428... -
Page 71
PART II ITEM 8 Financial Statements and Supplementary Data Consolidated Cash Flows Year Ended (In thousands) June 30, 2012 $ 1,121,585 70,319 416,943 (177,906) 33,359 (958) $ July 2, 2011 1,152,030 59,235 402,588 (165,239) 42,623 (9,454) $ July 3, 2010 (53 Weeks) 1,179,983 66,358 389,976 (121,... -
Page 72
... Data Notes to Consolidated Financial Statements NOTE 1 Summary of Accounting Policies Business and Consolidation Sysco Corporation, acting through its subsidiaries and divisions, (Sysco or the company), is engaged in the marketing and distribution of a wide range of food and related products... -
Page 73
... corporate-owned life insurance (COLI) policies are recorded at their cash surrender values as of each balance sheet date. Changes in the cash surrender value during the period are recorded as a gain or loss within operating expenses. The company does not record deferred tax balances related to cash... -
Page 74
... reduction of cost of sales when the earnings process is complete, the related service is performed and the amounts are realized. Shipping and Handling Costs Shipping and handling costs include costs associated with the selection of products and delivery to customers. Included in operating expenses... -
Page 75
... does not change the accounting for multiemployer pension plans. The amendments in this update are effective for ï¬scal years ending after December 15, 2011. The required additional disclosures are included in Note 14, "Multiemployer Employee Beneï¬t Plans." 52 SYSCO CORPORATION - Form 10-K -
Page 76
... and related arrangements associated with its ï¬nancial instruments and derivative instruments. The disclosure requirements in this update are effective for annual reporting periods, and interim periods within those years, beginning on or after January 1, 2013, which will be ï¬scal 2014 for Sysco... -
Page 77
...use software related to the Business Transformation Project will be placed into service and begin amortization in August of ï¬scal 2013. Depreciation expense, including capital leases, for the past three years was $384.9 million in 2012, $374.0 million in 2011 and $361.7 million in 2010. 54 SYSCO... -
Page 78
...30, 2012 is shown below: (In thousands) 2013 2014 2015 2016 2017 $ Amount 24,987 23,525 18,914 12,209 7,505 NOTE 8 Derivative Financial Instruments Sysco manages its debt portfolio to achieve an overall desired position of ï¬xed and ï¬,oating rates and may employ interest rate swaps from time... -
Page 79
... self-insured levels are fully insured by third party insurers. The company also maintains a fully self-insured group medical program. A summary of the activity in self-insured liabilities appears below: (In thousands) Balance at beginning of period Charged to costs and expenses Payments BALANCE AT... -
Page 80
PART II ITEM 8 Financial Statements and Supplementary Data The principal payments required to be made during the next ï¬ve ï¬scal years on debt outstanding as of June 30, 2012 are shown below: (In thousands) 2013 2014 2015 2016 2017 $ Amount 254,650 210,799 302,135 2,340 1,807 Short-term ... -
Page 81
... table presents details of the company's other long-term liabilities: (In thousands) Qualiï¬ed pension plan Supplemental executive retirement plan Other TOTAL June 30, 2012 July 2, 2011 $ 456,969 $ 8,366 450,326 379,555 200,204 233,577 $ 1,107,499 $ 621,498 58 SYSCO CORPORATION - Form 10-K -
Page 82
...retirement plans for its employees. Also, the company provides certain health care beneï¬ts to eligible retirees and their dependents. Sysco maintains a qualiï¬ed pension plan (Retirement Plan) that pays beneï¬ts to employees at retirement, using formulas based on a participant's years of service... -
Page 83
... 185 (388) (490) 153 153 870 $ 738 Net company-sponsored pension costs decreased $27.3 million in ï¬scal 2012 due primarily to higher returns on assets of Sysco's Retirement Plan during ï¬scal 2011. Net company-sponsored pension costs in ï¬scal 2013 are expected to decrease by approximately $26... -
Page 84
PART II ITEM 8 Financial Statements and Supplementary Data Other changes in plan assets and beneï¬t obligations recognized in other comprehensive income (loss) related to company-sponsored pension plans for each ï¬scal year are as follows: Pension Beneï¬ts (In thousands) 2012 $ 4,806 $ 60,166 ... -
Page 85
...ï¬t payments and to balance risk and return commensurate with ongoing changes in the valuation of plan liabilities. In order to accomplish these objectives, the company oversees the Retirement Plan's investment objectives and policy design, decides proper plan asset class strategies and structures... -
Page 86
... value. Cash and cash equivalents: Valued at amortized cost, which approximates fair value. Cash and cash equivalents is included as a Level 2 measurement in the table below. Equity securities: Valued at the closing price reported on the exchange market. If a stock is not listed on a public exchange... -
Page 87
PART II ITEM 8 Financial Statements and Supplementary Data Derivatives: Valuation method varies by type of derivative security. • Credit default and interest rate swaps: Valued using evaluated bid prices based on a compilation of observable market information. Inputs used for credit default swaps... -
Page 88
... a summary of changes in the fair value of the Retirement Plan's Level 3 assets for each ï¬scal year: (In thousands) Balance, July 3, 2010 Actual return on plan assets: Relating to assets still held at the reporting date Relating to assets sold during the period Purchases and sales, net Transfers... -
Page 89
... the period of payment to reï¬,ect any changes to these estimates. If any of these plans were to undergo a mass withdrawal, as deï¬ned by the Pension Beneï¬t Guaranty Corporation, within a two year time frame from the point of our withdrawal, Sysco could have additional liability. The company does... -
Page 90
... II ITEM 8 Financial Statements and Supplementary Data Individually Signiï¬cant Plans The information in the following tables relates to multiemployer deï¬ned beneï¬t pension plans which Sysco has determined to be individually signiï¬cant to the company. To determine individually signiï¬cant... -
Page 91
... New York State Teamsters Conference Pension and Retirement Fund Truck Drivers and Helpers Local Union No. 355 Retirement Pension Fund Cleveland Bakers and Teamsters Pension Fund Minneapolis Food Distributing Industry Pension Plan $ 2012 19,829 $ 33,032 2,227 1,395 1,490 1,189 4,556 2010 2011... -
Page 92
PART II ITEM 8 Financial Statements and Supplementary Data NOTE 16 Comprehensive Income Comprehensive income is net earnings plus certain other items that are recorded directly to shareholders' equity, such as foreign currency translation adjustments, amounts related to cash ï¬,ow hedging ... -
Page 93
... Compensation Sysco provides compensation beneï¬ts to employees and non-employee directors under several share-based payment arrangements including various employee stock option plans, the Employees' Stock Purchase Plan, the Management Incentive Plan and various non-employee director plans. Stock... -
Page 94
... life of seven years. As of June 30, 2012, there were 554,828 remaining shares authorized and available for grant in total under the 2009 Non-Employee Directors Stock Plan. Stock Options Sysco's option awards are subject to graded vesting over a service period. Sysco recognizes compensation cost... -
Page 95
...2012, 2011 and 2010 was $2.2 million, $1.7 million and $1.4 million, respectively. Restricted stock shares are valued on their vesting date. Vested deferred units are valued on their subsequent conversion and distribution date. Under the 2009 Non-Employee Directors Stock Plan, non-employee directors... -
Page 96
... compensation arrangements. That cost is expected to be recognized over a weighted-average period of 2.36 years. Cash received from option exercises and purchases of shares under the Employees' Stock Purchase Plan was $99.4 million, $332.7 million and $94.8 million during ï¬scal 2012, 2011 and 2010... -
Page 97
... and local income taxes, net of any applicable federal income tax beneï¬t Foreign income taxes Impact of uncertain tax beneï¬ts Impact of adjusting carrying value of corporate-owned life insurance policies to their cash surrender values Other 2012 35.00% 2.65 (1.07) 0.12 (0.08) 0.51 37.13% 2011 35... -
Page 98
... foodservice operations in Sacramento, California; Quebec, Canada; New Haven, Connecticut; Grand Rapids, Michigan; Minneapolis, Minnesota; Columbia, South Carolina and Spokane, Washington. In addition, Sysco acquired for cash a company that distributes specialty imported products headquartered in... -
Page 99
...international customers. The accounting policies for the segments are the same as those disclosed by Sysco for its consolidated ï¬nancial statements. Intersegment sales represent specialty produce and imported specialty products distributed by the Broadline and SYGMA operating companies. Management... -
Page 100
PART II ITEM 8 Financial Statements and Supplementary Data The following table sets forth the ï¬nancial information for Sysco's business segments: Fiscal Year (In thousands) 2012 $ 34,420,851 $ 5,735,673 2,396,113 (171,698) 42,380,939 $ 2,416,225 $ 60,967 91,048 2,568,240 (677,608) 1,890,632 113,... -
Page 101
...8 Financial Statements and Supplementary Data The sales mix for the principal product categories for each ï¬scal year is as follows: Fiscal Year (In thousands) Canned and dry products Fresh and frozen meats Frozen fruits, vegetables, bakery and other Dairy products Poultry Fresh produce Paper and... -
Page 102
PART II ITEM 8 Financial Statements and Supplementary Data NOTE 22 Supplemental Guarantor Information - Subsidiary Guarantees On January 19, 2011, the wholly-owned U.S. Broadline subsidiaries of Sysco Corporation entered into full and unconditional guarantees of all outstanding senior notes and ... -
Page 103
PART II ITEM 8 Financial Statements and Supplementary Data (In thousands) Sales Cost of sales Gross proï¬t Operating expenses Operating income (loss) Interest expense (income) Other expense (income), net Earnings (losses) before income taxes Income tax (beneï¬t) provision Equity in earnings of ... -
Page 104
PART II ITEM 8 Financial Statements and Supplementary Data (In thousands) Sysco $ Condensed Consolidating Cash Flows Year Ended June 30, 2012 Other NonU.S. Broadline Guarantor Subsidiaries Subsidiaries 1,674,817 $ (367,909) (2,038) (1,302,546) 2,324 32,154 34,478 $ 142,898 $ (313,237) (382,443) ... -
Page 105
...per share data) Sales Cost of sales Gross proï¬t Operating expenses Operating income Interest expense Other (income), net Earnings before income taxes Income taxes NET EARNINGS Per share: BASIC NET EARNINGS DILUTED NET EARNINGS Dividends declared Market price - high/low PERCENTAGE CHANGE - 2012 VS... -
Page 106
... as of June 30, 2012, our chief executive ofï¬cer and chief ï¬nancial ofï¬cer concluded that, as of such date, Sysco's disclosure controls and procedures were effective at the reasonable assurance level. Management's report on internal control over ï¬nancial reporting is included in the... -
Page 107
... of the Compensation Committee," "Director Compensation" and "Executive Compensation." ITEM 12 Security Ownership of Certain Beneï¬cial Owners and Management and Related Stockholder Matters The information required by this item will be included in our proxy statement for the 2012 Annual Meeting of... -
Page 108
... of this Form 10-K. All ï¬nancial statement schedules are omitted because they are not applicable or the information is set forth in the consolidated ï¬nancial statements or notes thereto within Item 8. Financial Statements and Supplementary Data. Exhibits. 3. The exhibits listed on the Exhibit... -
Page 109
... and Chief Executive Ofï¬cer Pursuant to the requirements of the Securities Exchange Act of 1934, this report has been signed below by the following persons on behalf of Sysco Corporation in the capacities indicated and on the date indicated above. Principal Executive, Financial & Accounting Of... -
Page 110
... Relations Department, Sysco Corporation, at the corporate offices listed above, or by calling 281.584.2615. This information, which is included in this Annual Report, also may be found on our website at www.sysco.com in the Investors section. Design: SAVAGE, Branding + Corporate Design, Houston... -
Page 111
...enclave Parkway Houston, texas 77077-2099 281.584.1390 www.sysco.com Good things Printed on fSC ®-certified, 100% post-consumer recycled paper, and paper made from environmentally responsible Eucalyptus pulp. The use of 100% post-consumer recycled fiber in the printing of this report saved: • 55...