Sysco 2012 Annual Report Download - page 87
Download and view the complete annual report
Please find page 87 of the 2012 Sysco annual report below. You can navigate through the pages in the report by either clicking on the pages listed below, or by using the keyword search tool below to find specific information within the annual report.-
 1
1 -
2
-
3
-
4
-
5
-
6
-
7
-
8
-
9
-
10
-
11
-
12
-
13
-
14
-
15
-
16
-
17
-
18
-
19
-
20
-
21
-
22
-
23
-
24
-
25
-
26
-
27
-
28
-
29
-
30
-
31
-
32
-
33
-
34
-
35
-
36
-
37
-
38
-
39
-
40
-
41
-
42
-
43
-
44
-
45
-
46
-
47
-
48
-
49
-
50
-
51
-
52
-
53
-
54
-
55
-
56
-
57
-
58
-
59
-
60
-
61
-
62
-
63
-
64
-
65
-
66
-
67
-
68
-
69
-
70
-
71
-
72
-
73
-
74
-
75
-
76
-
 77
77 -
 78
78 -
 79
79 -
 80
80 -
 81
81 -
 82
82 -
 83
83 -
 84
84 -
 85
85 -
 86
86 -
 87
87 -
 88
88 -
 89
89 -
 90
90 -
 91
91 -
 92
92 -
 93
93 -
 94
94 -
 95
95 -
 96
96 -
 97
97 -
98
-
99
-
100
-
101
-
102
-
103
-
104
-
105
-
106
-
107
-
108
-
109
-
110
-
111
 |
 |

SYSCO CORPORATION-Form10-K64
PARTII
ITEM8Financial Statements and Supplementary Data
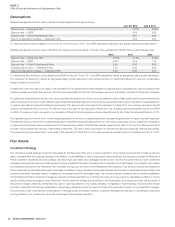
Derivatives: Valuation method varies by type of derivative security.
•
Credit default and interest rate swaps: Valued using evaluated bid prices based on a compilation of observable market information. Inputs used for credit
default swaps include spread curves and trade data about the credit quality of the counterparty. Inputs used for interest rate swaps include benchmark
yields, swap curves, cash fl ow analysis, and interdealer broker rates. Credit default and interest rate swaps are included as a Level2 measurement in
the table below.
•
Foreign currency contracts: Valued using a standardized interpolation model that utilizes the quoted prices for standard-length forward foreign currency
contracts and adjusts to the remaining term outstanding on the contract being valued. Foreign currency contracts are included as a Level2 measurement
in the table below.
•
Futures and option contracts: Valued at the closing price reported on the exchange market for exchange-traded futures and options. Over-the-counter
options are valued using pricing models that are based on observable market information. Exchange-traded futures and options are included as a
Level1 measurement in the table below; over-the-counter options are included as a Level2 measurement.
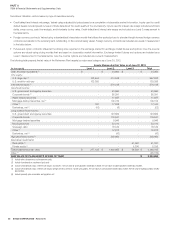
The following table presents the fair value of the Retirement Plan’s assets by major asset category as of June30,2012:
(In thousands)
Assets Measured at Fair Value as of June30,2012
Level1 Level2 Level3 Total
Cash and cash equivalents(1) $ - $ 44,904 $ - $ 44,904
U.S. equity:
U.S. large-cap(1) 143,544 414,048 - 557,592
U.S. small-to-mid-cap 133,388 - - 133,388
International equity(2) - 670,139 - 670,139
Core fi xed income:
U.S. government and agency securities - 43,690 - 43,690
Corporate bonds(1) - 85,391 - 85,391
Asset-backed securities - 11,937 - 11,937
Mortgage-backed securities, net(1) - 106,722 - 106,722
Other(1) 192 17,248 - 17,440
Derivatives, net(3) (16) (6) - (22)
Long duration fi xed income:
U.S. government and agency securities - 143,825 - 143,825
Corporate bonds - 119,947 - 119,947
Mortgage-backed securities - 9,946 - 9,946
Municipal bonds - 22,014 - 22,014
Sovereign debt - 18,126 - 18,126
Other(1) - 12,813 - 12,813
Derivatives, net(4) - (43) - (43)
High yield fi xed income(2) - 205,984 - 205,984
Alternative investments:
Real estate(2) - - 51,097 51,097
Private equity(2) - - 5,295 5,295
Total investments at fair value $ 277,108 $ 1,926,685 $ 56,392 $ 2,260,185
Other(5) (25,316)
FAIR VALUE OF PLAN ASSETS AT END OF YEAR $ 2,234,869
(1) Include direct investments and investment funds.
(2) Include investments in investment funds only.
(3) Include credit default swaps, interest rate swaps, and futures. The fair value of asset positions totaled $0.3million; the fair value of liability positions totaled $0.3million.
(4) Include credit default swaps, interest rate swaps, foreign currency contracts, futures and options. The fair value of asset positions totaled $0.5million; the fair value of liability positions totaled
$0.6million.
(5) Include primarily plan receivables and payables, net.