Sysco 2012 Annual Report Download - page 45
Download and view the complete annual report
Please find page 45 of the 2012 Sysco annual report below. You can navigate through the pages in the report by either clicking on the pages listed below, or by using the keyword search tool below to find specific information within the annual report.-
 1
1 -
2
-
3
-
4
-
5
-
6
-
7
-
8
-
9
-
10
-
11
-
12
-
13
-
14
-
15
-
16
-
17
-
18
-
19
-
20
-
21
-
22
-
23
-
24
-
25
-
26
-
27
-
28
-
29
-
30
-
31
-
32
-
33
-
34
-
 35
35 -
 36
36 -
 37
37 -
 38
38 -
 39
39 -
 40
40 -
 41
41 -
 42
42 -
 43
43 -
 44
44 -
 45
45 -
 46
46 -
 47
47 -
 48
48 -
 49
49 -
 50
50 -
 51
51 -
 52
52 -
 53
53 -
 54
54 -
 55
55 -
56
-
57
-
58
-
59
-
60
-
61
-
62
-
63
-
64
-
65
-
66
-
67
-
68
-
69
-
70
-
71
-
72
-
73
-
74
-
75
-
76
-
77
-
78
-
79
-
80
-
81
-
82
-
83
-
84
-
85
-
86
-
87
-
88
-
89
-
90
-
91
-
92
-
93
-
94
-
95
-
96
-
97
-
98
-
99
-
100
-
101
-
102
-
103
-
104
-
105
-
106
-
107
-
108
-
109
-
110
-
111
 |
 |
SYSCO CORPORATION-Form10-K22
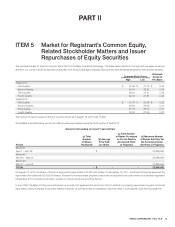
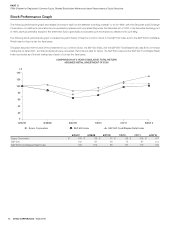
PARTII
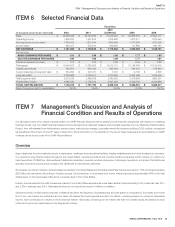
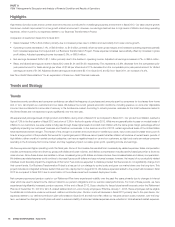
ITEM7Management’s Discussion and Analysis of Financial Condition and Results of Operations
The effective tax rate of 36.20% for fi scal 2010 was favorably impacted primarily by two items. First, we recorded an income tax benefi t of approximately
$29.0million resulting from the one-time reversal of a previously accrued liability related to the settlement with the IRS (See Note18, “Income Taxes” for
additional discussion). Second, the gain of $21.6million recorded to adjust the carrying value of COLI policies to their cash surrender values in fi scal 2010
was non-taxable for income tax purposes, and had the impact of decreasing income tax expense for the period by $8.3million.
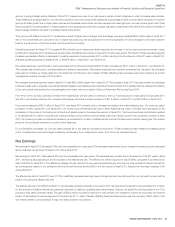
Earnings Per Share
Basic and diluted earnings per share in fi scal 2012 were $1.91 and $1.90, respectively. This represents a 2.6% decrease from the comparable prior year
period amount for basic earnings per share of $1.96 per share and a 3.1% decrease from the comparable prior year period amount for diluted earnings
per share of $1.96. This decrease was primarily the result of the factors discussed above. Adjusted diluted earnings per share was $2.13 in fi scal 2012
and $2.04 in fi scal 2011, or an increase of 4.4%.
Basic and diluted earnings per share decreased 1.5% in fi scal 2011 from the prior year. This decrease was primarily the result of the absence of the 53rd
week in fi scal 2011 and the factors discussed above, as well as a net reduction in shares outstanding. The net reduction in both average and diluted
shares outstanding was primarily due to share repurchases which occurred during the fi rst 26 weeks of fi scal 2011. Adjusted diluted earnings per share
were $2.04 in fi scal 2011 and $1.95 in fi scal 2010, or an increase of 4.6%.
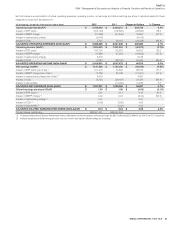
Non-GAAP Reconciliations
Sysco’s results of operations are impacted by costs from our multi-year Business Transformation Project (BTP), signifi cant charges from the withdrawal from
a multiemployer pension plan (MEPP), restructuring charges and recognized tax benefi ts. Additionally, near the end of fi scal 2011, we reallocated all of our
investments in our COLI policies into low-risk, fi xed-income securities and therefore we do not expect signifi cant volatility in operating expenses, operating
income, net earnings and diluted earnings per share in future periods related to these policies. We experienced signifi cant gains in these policies during
fi scal 2011. Management believes that adjusting its operating expenses, operating income, net earnings and diluted earnings per share to remove the
impact of the Business Transformation Project expenses, multiemployer pension plan charges, restructuring charges, COLI gains and tax benefi ts provides
an important perspective with respect to underlying business trends and results and provides meaningful supplemental information to both management
and investors that is indicative of the performance of the company’s underlying operations and facilitates comparison on a year-over year basis.
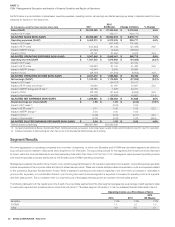
In addition, Sysco’s fi scal year ends on the Saturday nearest to June30th. This resulted in a 52-week year ending June30,2012 for fi scal 2012, a 52-week
year ending July2,2011 for fi scal 2011 and a 53-week year ending July3,2010 for fi scal 2010. Because the fourth quarter of fi scal 2010 contained an
additional week as compared to fi scal 2011, our results of operations for fi scal 2010 are not directly comparable to fi scal 2011. Management believes that
adjusting the fi scal 2010 results of operations for the estimated impact of the additional week provides more comparable fi nancial results on a year-over-year
basis. As a result, in the non-GAAP reconciliation below for fi scal 2011 compared to fi scal 2010, in addition to the specifi c line item impacts noted above,
operating items have been adjusted by one-fourteenth of the total metric for the fourth quarter of fi scal 2010. Failure to make these adjustments would
cause the year-over-year changes in certain metrics such as sales, operating income, net earnings and diluted earnings per share to be overstated, whereas
in certain cases, a metric may actually have increased rather than declined or declined rather than increased on a more comparable year-over-year basis.
The company uses these non-GAAP measures when evaluating its fi nancial results as well as for internal planning and forecasting purposes. These fi nancial
measures should not be used as a substitute in assessing the company’s results of operations for periods presented. An analysis of any non-GAAP fi nancial
measure should be used in conjunction with results presented in accordance with GAAP. As a result, in the tables below, each period presented is adjusted
to remove expenses related to the Business Transformation Project, signifi cant charges incurred from the withdrawal from a multiemployer pension plan,
restructuring charges, gains recorded on the adjustments to the carrying value of COLI policies and to remove the impact of tax benefi ts in fi scal 2011. In
addition, fi scal 2010 results are adjusted to remove the estimate impact of the 53rd week.