Sysco 2012 Annual Report Download - page 69
Download and view the complete annual report
Please find page 69 of the 2012 Sysco annual report below. You can navigate through the pages in the report by either clicking on the pages listed below, or by using the keyword search tool below to find specific information within the annual report.-
 1
1 -
2
-
3
-
4
-
5
-
6
-
7
-
8
-
9
-
10
-
11
-
12
-
13
-
14
-
15
-
16
-
17
-
18
-
19
-
20
-
21
-
22
-
23
-
24
-
25
-
26
-
27
-
28
-
29
-
30
-
31
-
32
-
33
-
34
-
35
-
36
-
37
-
38
-
39
-
40
-
41
-
42
-
43
-
44
-
45
-
46
-
47
-
48
-
49
-
50
-
51
-
52
-
53
-
54
-
55
-
56
-
57
-
58
-
 59
59 -
 60
60 -
 61
61 -
 62
62 -
 63
63 -
 64
64 -
 65
65 -
 66
66 -
 67
67 -
 68
68 -
 69
69 -
 70
70 -
 71
71 -
 72
72 -
 73
73 -
 74
74 -
 75
75 -
 76
76 -
 77
77 -
 78
78 -
 79
79 -
80
-
81
-
82
-
83
-
84
-
85
-
86
-
87
-
88
-
89
-
90
-
91
-
92
-
93
-
94
-
95
-
96
-
97
-
98
-
99
-
100
-
101
-
102
-
103
-
104
-
105
-
106
-
107
-
108
-
109
-
110
-
111
 |
 |

SYSCO CORPORATION-Form10-K46
PARTII
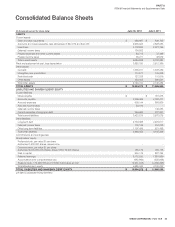
ITEM8Financial Statements and Supplementary Data
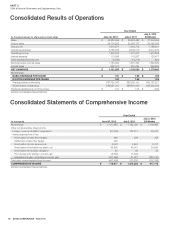
Consolidated Results of Operations
(In thousands except for share and per share data)
Year Ended
June30,2012 July2,2011
July3,2010
(53Weeks)
Sales $ 42,380,939 $ 39,323,489 $ 37,243,495
Cost of sales 34,704,362 31,928,777 30,055,188
Gross profi t 7,676,577 7,394,712 7,188,307
Operating expenses 5,785,945 5,463,210 5,212,439
Operating income 1,890,632 1,931,502 1,975,868
Interest expense 113,396 118,267 125,477
Other expense (income), net (6,766) (14,219) 802
Earnings before income taxes 1,784,002 1,827,454 1,849,589
Income taxes 662,417 675,424 669,606
NET EARNINGS $ 1,121,585 $ 1,152,030 $ 1,179,983
Net earnings:
BASIC EARNINGS PER SHARE $ 1.91 $ 1.96 $ 1.99
DILUTED EARNINGS PER SHARE 1.90 1.96 1.99
Average shares outstanding 587,726,343 586,526,142 592,157,221
Diluted shares outstanding 588,991,441 588,691,546 593,590,042
Dividends declared per common share $ 1.07 $ 1.03 $ 0.99
See Notes to Consolidated Financial Statements
Consolidated Statements of Comprehensive Income
(In thousands)
Year Ended
June30,2012 July2,2011
July3,2010
(53Weeks)
Net earnings $ 1,121,585 $ 1,152,030 $ 1,179,983
Other comprehensive (loss) income:
Foreign currency translation adjustment (81,003) 122,217 49,973
Items presented net of tax:
Amortization of cash fl ow hedges 426 428 428
Settlement of cash fl ow hedge 445 - -
Amortization of prior service cost 3,093 2,553 2,707
Amortization of actuarial loss (gain), net 36,860 49,013 24,664
Amortization of transition obligation 93 93 93
Prior service cost arising in current year (5,363) (5,692) -
Actuarial (loss) gain, net arising in current year (357,459) 51,681 (280,130)
Total other comprehensive (loss) income (402,908) 220,293 (202,265)
COMPREHENSIVE INCOME $ 718,677 $ 1,372,323 $ 977,718
See Notes to Consolidated Financial Statements