Sysco 2012 Annual Report Download - page 81
Download and view the complete annual report
Please find page 81 of the 2012 Sysco annual report below. You can navigate through the pages in the report by either clicking on the pages listed below, or by using the keyword search tool below to find specific information within the annual report.-
 1
1 -
2
-
3
-
4
-
5
-
6
-
7
-
8
-
9
-
10
-
11
-
12
-
13
-
14
-
15
-
16
-
17
-
18
-
19
-
20
-
21
-
22
-
23
-
24
-
25
-
26
-
27
-
28
-
29
-
30
-
31
-
32
-
33
-
34
-
35
-
36
-
37
-
38
-
39
-
40
-
41
-
42
-
43
-
44
-
45
-
46
-
47
-
48
-
49
-
50
-
51
-
52
-
53
-
54
-
55
-
56
-
57
-
58
-
59
-
60
-
61
-
62
-
63
-
64
-
65
-
66
-
67
-
68
-
69
-
70
-
 71
71 -
 72
72 -
 73
73 -
 74
74 -
 75
75 -
 76
76 -
 77
77 -
 78
78 -
 79
79 -
 80
80 -
 81
81 -
 82
82 -
 83
83 -
 84
84 -
 85
85 -
 86
86 -
 87
87 -
 88
88 -
 89
89 -
 90
90 -
 91
91 -
92
-
93
-
94
-
95
-
96
-
97
-
98
-
99
-
100
-
101
-
102
-
103
-
104
-
105
-
106
-
107
-
108
-
109
-
110
-
111
 |
 |

SYSCO CORPORATION-Form10-K58
PARTII
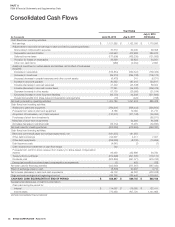
ITEM8Financial Statements and Supplementary Data
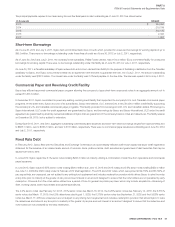
The 7.16% debentures due April15,2027 are unsecured, are not subject to any sinking fund requirement and are no longer redeemable prior to maturity.
Sysco’s Industrial Revenue Bonds have varying structures. Final maturities range from three to 14 years and certain of the bonds provide Sysco the right
to redeem the bonds at various dates. These redemption provisions generally provide the bondholder a premium in the early redemption years, declining
to par value as the bonds approach maturity.
Total Debt
Total debt as of June30,2012 was $3,018.3million of which approximately 84% was at fi xed rates with a weighted average of 4.7% and an average life
of 13 years, and the remainder was at fl oating rates with a weighted average of 2.3% and an average life of one year. Certain loan agreements contain
typical debt covenants to protect note holders, including provisions to maintain the company’s long-term debt to total capital ratio below a specifi ed level.
Sysco is currently in compliance with all debt covenants.
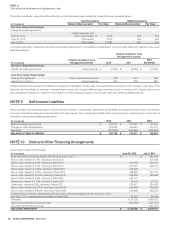
Other
As of June30,2012 and July2,2011, letters of credit outstanding were $29.8million and $23.0million, respectively.
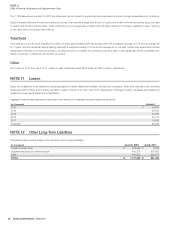
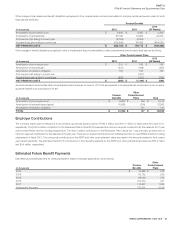
NOTE11 Leases
Sysco has obligations under capital and operating leases for certain distribution facilities, vehicles and computers. Total rental expense under operating
leases was $83.0million, $79.3million, and $80.7million in fi scal 2012,2011 and 2010, respectively. Contingent rentals, subleases and assets and
obligations under capital leases are not signifi cant.
Aggregate minimum lease payments by fi scal year under existing non-capitalized long-term leases are as follows:
(In thousands)
Amount
2013 $ 48,680
2014 38,943
2015 33,283
2016 24,775
2017 18,806
Thereafter 60,634
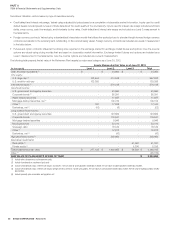
NOTE12 Other Long-Term Liabilities
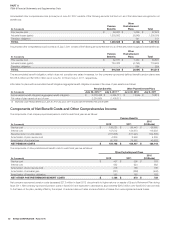
The following table presents details of the company’s other long-term liabilities:
(In thousands)
June30,2012 July2,2011
Qualifi ed pension plan $ 456,969 $ 8,366
Supplemental executive retirement plan 450,326 379,555
Other 200,204 233,577
TOTAL $ 1,107,499 $ 621,498