Sysco 2012 Annual Report Download - page 94
Download and view the complete annual report
Please find page 94 of the 2012 Sysco annual report below. You can navigate through the pages in the report by either clicking on the pages listed below, or by using the keyword search tool below to find specific information within the annual report.-
 1
1 -
2
-
3
-
4
-
5
-
6
-
7
-
8
-
9
-
10
-
11
-
12
-
13
-
14
-
15
-
16
-
17
-
18
-
19
-
20
-
21
-
22
-
23
-
24
-
25
-
26
-
27
-
28
-
29
-
30
-
31
-
32
-
33
-
34
-
35
-
36
-
37
-
38
-
39
-
40
-
41
-
42
-
43
-
44
-
45
-
46
-
47
-
48
-
49
-
50
-
51
-
52
-
53
-
54
-
55
-
56
-
57
-
58
-
59
-
60
-
61
-
62
-
63
-
64
-
65
-
66
-
67
-
68
-
69
-
70
-
71
-
72
-
73
-
74
-
75
-
76
-
77
-
78
-
79
-
80
-
81
-
82
-
83
-
 84
84 -
 85
85 -
 86
86 -
 87
87 -
 88
88 -
 89
89 -
 90
90 -
 91
91 -
 92
92 -
 93
93 -
 94
94 -
 95
95 -
 96
96 -
 97
97 -
 98
98 -
 99
99 -
 100
100 -
 101
101 -
 102
102 -
 103
103 -
 104
104 -
105
-
106
-
107
-
108
-
109
-
110
-
111
 |
 |

SYSCO CORPORATION-Form10-K 71
PARTII
ITEM8Financial Statements and Supplementary Data
by individual grant and include either time-based vesting or vesting based on performance criteria. The contractual life of all options granted under these
plans through July3,2004 is 10years; options granted after July3,2004 have a contractual life of seven years. As of June30,2012, there were 554,828
remainingshares authorized and available for grant in total under the 2009 Non-Employee Directors Stock Plan.
Stock Options
Sysco’s option awards are subject to graded vesting over a service period. Sysco recognizes compensation cost on a straight-line basis over the requisite
service period for the entire award.
In addition, certain of Sysco’s options provide that the options continue to vest as if the optionee continued to be an employee or director if the optionee
meets certain age and years of service thresholds upon retirement. In these cases, Sysco will recognize compensation cost for such awards over the period
from the grant date to the date the employee or director fi rst becomes eligible to retire with the options continuing to vest after retirement.
The fair value of each option award is estimated as of the date of grant using a Black-Scholes option pricing model. The weighted average assumptions
for the periods indicated are noted in the following table. Expected volatility is based on historical volatility of Sysco’s stock, implied volatilities from traded
options on Sysco’s stock and other factors. Sysco utilizes historical data to estimate option exercise and employee termination behavior within the valuation
model; separate groups of employees that have similar historical exercise behavior are considered separately for valuation purposes. Expected dividend
yield is estimated based on the historical pattern of dividends and the average stock price for the year preceding the option grant. The risk-free rate for
the expected term of the option is based on the U.S. Treasury yield curve in effect at the time of grant.
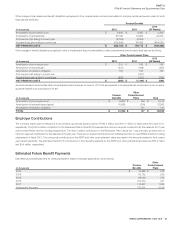
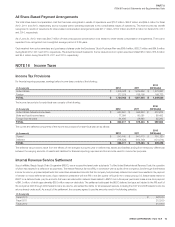
The following weighted-average assumptions were used for each fi scal year presented:
2012 2011 2010
Dividend yield 3.7% 3.5% 3.6%
Expected volatility 23.4 23.4 25.4
Risk-free interest rate 1.0 1.2 2.3
Expected life 5.4 years 5.0years 4.9 years
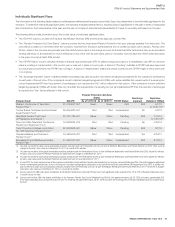
The following summary presents information regarding outstanding options as of June30,2012 and changes during the fi scal year then ended with regard to
options under all stock incentive plans:
Shares Under
Option
Weighted
Average
Exercise Price
Per Share
Weighted Average
Remaining
Contractual Term
(in years)
Aggregate
Intrinsic Value
(in thousands)
Outstanding as of July2,2011 67,392,308 $ 30.05
Granted 7,015,952 27.82
Exercised (2,467,747) 26.70
Forfeited (762,556) 27.98
Expired (11,953,731) 30.55
OUTSTANDING AS OF JUNE30,2012 59,224,226 $ 29.85 2.78 $ 65,617
VESTED OR EXPECTED TO VEST AS OF JUNE30,2012 58,805,665 $ 29.86 2.77 $ 64,803
EXERCISABLE AS OF JUNE30,2012 37,893,930 $ 30.93 1.52 $ 21,052
The total number of employee options granted was 7,015,952, 7,190,250 and 8,494,200 in fi scal years 2012,2011 and 2010, respectively. During fi scal
2012, 2,898,854 options were granted to 11 executive offi cers and 4,117,098 options were granted to approximately 180 other key employees. During fi scal
2011, 1,423,000 options were granted to 11 executive offi cers and 5,767,250 options were granted to approximately 1,500 other key employees. During
fi scal 2010, 1,451,500 options were granted to 12 executive offi cers and 7,042,700 options were granted to approximately 1,600 other key employees.
The weighted average grant-date fair value of options granted in fi scal 2012,2011 and 2010 was $3.69, $3.96 and $4.53, respectively. The total intrinsic
value of options exercised during fi scal 2012,2011 and 2010 was $8.3million, $45.5million and $16.3million, respectively.
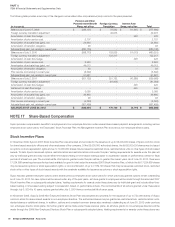
Restricted Stock Units
During fi scal 2012,2011 and 2010, 1,528,734, 656,000 and 652,300 restricted stock units, respectively, were granted to employees that will vest ratably
over a three-year period. Some of these restricted stock units were granted with dividend equivalents. The fair value of each restricted stock unit award
granted with a dividend equivalent is based on the company’s stock price as of the date of grant. For restricted stock unit awards granted without dividend
equivalents, the fair value was reduced by the present value of expected dividends during the vesting period. The weighted average grant-date fair value
per share of restricted stock units granted during fi scal 2012,2011 and 2010 was $27.35, $28.72 and $27.24, respectively. The total fair value of restricted
stock units vested during fi scal 2012 and 2011 was $11.8million and $6.2million, respectively. There were no vestings of restricted stock units in fi scal 2010.