Sysco 2012 Annual Report Download - page 39
Download and view the complete annual report
Please find page 39 of the 2012 Sysco annual report below. You can navigate through the pages in the report by either clicking on the pages listed below, or by using the keyword search tool below to find specific information within the annual report.-
 1
1 -
2
-
3
-
4
-
5
-
6
-
7
-
8
-
9
-
10
-
11
-
12
-
13
-
14
-
15
-
16
-
17
-
18
-
19
-
20
-
21
-
22
-
23
-
24
-
25
-
26
-
27
-
28
-
 29
29 -
 30
30 -
 31
31 -
 32
32 -
 33
33 -
 34
34 -
 35
35 -
 36
36 -
 37
37 -
 38
38 -
 39
39 -
 40
40 -
 41
41 -
 42
42 -
 43
43 -
 44
44 -
 45
45 -
 46
46 -
 47
47 -
 48
48 -
 49
49 -
50
-
51
-
52
-
53
-
54
-
55
-
56
-
57
-
58
-
59
-
60
-
61
-
62
-
63
-
64
-
65
-
66
-
67
-
68
-
69
-
70
-
71
-
72
-
73
-
74
-
75
-
76
-
77
-
78
-
79
-
80
-
81
-
82
-
83
-
84
-
85
-
86
-
87
-
88
-
89
-
90
-
91
-
92
-
93
-
94
-
95
-
96
-
97
-
98
-
99
-
100
-
101
-
102
-
103
-
104
-
105
-
106
-
107
-
108
-
109
-
110
-
111
 |
 |

SYSCO CORPORATION-Form10-K16
PARTII
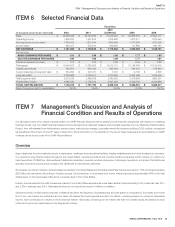
ITEM7Management’s Discussion and Analysis of Financial Condition and Results of Operations
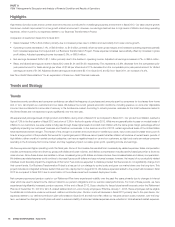
Highlights
High levels of product costs and an uneven economic recovery contributed to a challenging business environment in fi scal 2012. Our case volume growth
has shown modest improvement in a low growth market environment. However, our earnings declined due to high levels of infl ation and rising operating
expenses, driven in part by our expenses related to our Business Transformation Project.
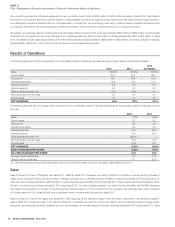
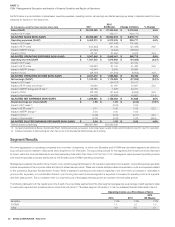
Comparison of results from fi scal 2012 to fi scal 2011:
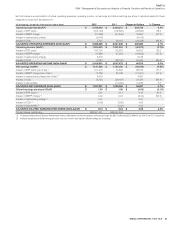
•Sales increased 7.8% to $42.4billion primarily due to increased prices due to infl ation and secondarily from case volume growth.
•
Operating income decreased 2.1%, or $40.9million, to $1.9billion, primarily driven by lower gross margins and increased operating expenses partially
from increased expenses from payroll and our Business Transformation Project. These expense increases were partially offset by increases in gross
profi t dollars. Adjusted operating income increased 3.0%, or $60.9million.
•Net earnings decreased 2.6% to $1.1billion primarily due to the decline in operating income. Adjusted net earnings increased 4.7%, or $56.4million.
•
Basic and diluted earnings per share in fi scal 2012 were $1.91 and $1.90, respectively. This represents a 2.6% decrease from the comparable prior
year period amount for basic earnings per share of $1.96 per share and a 3.1% decrease from the comparable prior year period amount for diluted
earnings per share of $1.96. Adjusted diluted earnings per share were $2.13 in fi scal 2012 and $2.04 in fi scal 2011, an increase of 4.4%.
See “Non-GAAP Reconciliations” for an explanation of these non-GAAP fi nancial measures.
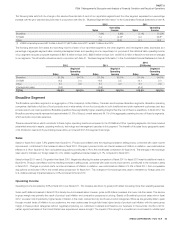
Trends and Strategy
Trends
General economic conditions and consumer confi dence can affect the frequency of purchases and amounts spent by consumers for food-away-from-home
and, in turn, can impact our customers and our sales. We believe the current general economic conditions, including pressure on consumer disposable
income, have contributed to a slow rate of recovery in the foodservice market. According to industry sources, real sales for the total foodservice market in
the UnitedStates are not expected to grow signifi cantly over the next year.
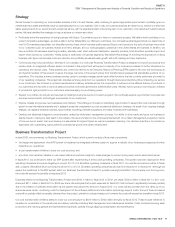
We experienced prolonged levels of high product cost infl ation during most of fi scal 2012 as compared to fi scal 2011. Our product cost infl ation reached a
high of 7.3% in the fi rst quarter of fi scal 2012 and a low of 3.3% in the fourth quarter of fi scal 2012. While we are generally able to pass on modest levels of
infl ation to our customers, we were unable to fully pass through these higher levels of product cost infl ation with the same gross margin percentage without
negatively impacting our customers’ business and therefore our business. In the summer months of 2012, certain agricultural areas of the UnitedStates
have experienced severe drought. The impact of this drought is uncertain and could result in volatile input costs. Input costs could increase at any point in
time for a large portion of the products that we sell for a prolonged period. While we cannot predict whether infl ation will continue at current levels, periods of
high infl ation, either overall or in certain product categories, can have a negative impact on us and our customers, as high food costs can reduce consumer
spending in the food-away-from-home market, and may negatively impact our sales, gross profi t, operating income and earnings.
We have experienced higher operating costs this fi scal year. Some of the increase has resulted from increased pay-related expenses. Sales compensation
includes commissions which are driven by gross profi t dollars and case volumes, and delivery compensation includes activity-based pay which is driven by
case volumes. Since these drivers are variable in nature, increased gross profi t dollars and case volumes have increased sales and delivery compensation.
We believe pay-related expense could continue to increase if gross profi t dollars and case volumes increase; however, the impact of our productivity related
initiatives could favorably impact the magnitude of this trend. Fuel costs are expected to stabilize provided that fuel prices do not signifi cantly change from
their current levels. Our Business Transformation Project is a key part of our strategy to control costs and grow our market share over the long-term. This
project includes an integrated software system that went into deployment in August2012. We believe expenses related to the project will increase in fi scal
2013 as compared to fi scal 2012 due to amortization of the software asset and increased deployment costs.
Net company-sponsored pension costs for our Retirement Plan have experienced volatility over the past fi ve years primarily due to changes in interest
rates which are used to determine the discount rates for our pension obligations and our pension asset performance. For most of these periods, we have
experienced signifi cantly increased pension expense. At the end of fi scal 2012, Sysco decided to freeze future benefi t accruals under the Retirement
Plan as of December31,2012 for all U.S.-based salaried and non-union hourly employees. Effective January1,2013, these employees will be eligible
for additional contributions under an enhanced, defi ned contribution plan. Pension costs will decrease in fi scal 2013 primarily due to this plan freeze. Our
expenses related to our defi ned contribution plan will increase in fi scal 2013 and will more than offset our reduced pension costs; however, over the long-
term, we believe the changes to both plans will result in reduced volatility of retirement related expenses and a reduction in total retirement related expenses.