Sysco 2012 Annual Report Download - page 49
Download and view the complete annual report
Please find page 49 of the 2012 Sysco annual report below. You can navigate through the pages in the report by either clicking on the pages listed below, or by using the keyword search tool below to find specific information within the annual report.-
 1
1 -
2
-
3
-
4
-
5
-
6
-
7
-
8
-
9
-
10
-
11
-
12
-
13
-
14
-
15
-
16
-
17
-
18
-
19
-
20
-
21
-
22
-
23
-
24
-
25
-
26
-
27
-
28
-
29
-
30
-
31
-
32
-
33
-
34
-
35
-
36
-
37
-
38
-
 39
39 -
 40
40 -
 41
41 -
 42
42 -
 43
43 -
 44
44 -
 45
45 -
 46
46 -
 47
47 -
 48
48 -
 49
49 -
 50
50 -
 51
51 -
 52
52 -
 53
53 -
 54
54 -
 55
55 -
 56
56 -
 57
57 -
 58
58 -
 59
59 -
60
-
61
-
62
-
63
-
64
-
65
-
66
-
67
-
68
-
69
-
70
-
71
-
72
-
73
-
74
-
75
-
76
-
77
-
78
-
79
-
80
-
81
-
82
-
83
-
84
-
85
-
86
-
87
-
88
-
89
-
90
-
91
-
92
-
93
-
94
-
95
-
96
-
97
-
98
-
99
-
100
-
101
-
102
-
103
-
104
-
105
-
106
-
107
-
108
-
109
-
110
-
111
 |
 |
SYSCO CORPORATION-Form10-K26
PARTII
ITEM7Management’s Discussion and Analysis of Financial Condition and Results of Operations
costs. Input costs could increase at any point in time for a large portion of the products that we sell for a prolonged period. While we cannot predict whether
infl ation will continue at these levels, prolonged periods of high infl ation, either overall or in certain product categories, can have a negative impact on our
customers, as high food costs can reduce consumer spending in the food-away-from-home market, and may negatively impact the Broadline segment’s
sales, gross profi t and earnings. Our product cost reduction initiative is designed to lower our total product costs by $250million to $300million annually
by fi scal 2015; however we believe the impact on our product costs in fi scal 2013 will be modest.
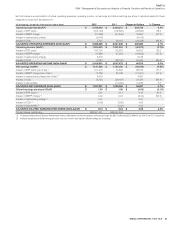
In addition, gross profi t dollars for fi scal 2012 increased as a result of higher fuel surcharges. Fuel surcharges were approximately $39.1million higher in
fi scal 2012 than the prior year due to the application of fuel surcharges to a broader customer base during fi scal 2012 due to higher fuel prices incurred
during these periods. Assuming that fuel prices do not greatly vary from recent levels, we expect the level of fuel surcharges in fi scal 2013 to remain
consistent with those experienced in fi scal 2012.
Operating expenses for the Broadline segment increased in fi scal 2012 as compared to fi scal 2011. The expense increases in fi scal 2012 were driven
largely by an increase in pay-related expenses and fuel costs, partially offset by a favorable comparison in the provisions recorded for the withdrawal from
multiemployer pension plans in each fi scal year. Sales compensation includes commissions which are driven by gross profi t dollars and case volumes,
and delivery compensation includes activity-based pay which is driven by case volumes. Since these drivers are variable in nature, increased gross profi t
dollars and case volumes will increase sales and delivery compensation. However, the impact of our productivity related initiatives could favorably impact
the magnitude of this trend. Fuel costs were $26.5million higher in fi scal 2012 than the prior year. Assuming that fuel prices do not rise signifi cantly over
recent levels during fi scal 2013, fuel costs exclusive of any amounts recovered through fuel surcharges, are not expected to fl uctuate signifi cantly as
compared to fi scal 2012. Our estimate is based upon current, published quarterly market price projections for diesel, the cost committed to in our forward
fuel purchase agreements currently in place for fi scal 2013 and estimates of fuel consumption. Actual fuel costs could vary from our estimates if any of
these assumptions change, in particular if future fuel prices vary signifi cantly from our current estimates. We continue to evaluate all opportunities to offset
potential increases in fuel expense, including the use of fuel surcharges and overall expense management.
From time to time, we may voluntarily withdraw from multiemployer pension plans to minimize or limit our future exposure to these plans. We recorded
provisions related to the withdrawal from multiemployer pension plans of $21.9million in fi scal 2012 and $41.5million in fi scal 2011.
We also measure our expense performance on a cost per case basis, which we seek to align with the gross profi t that we are able to generate. For our
Broadline companies, our cost per case increased $0.04 per case as compared to fi scal 2011 and $0.11 per case as compared to fi scal 2010. The
increases in both periods primarily related to increased fuel costs and payroll costs discussed above. Charges created by withdrawing from multiemployer
plans also contributed to the increase in fi scal 2011 as compared to fi scal 2010.
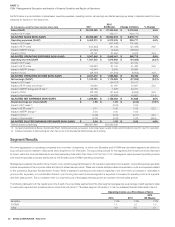
Operating income decreased 1.0% in fi scal 2011 over fi scal 2010 to $2.3billion, and as a percentage of sales, declined to 7.3% of sales. Gross profi t
dollars increased slightly below the rate that operating expenses increased; however, operating expenses included a signifi cant unfavorable comparison
in the provisions recorded for the withdrawal from multiemployer pension plans in each fi scal year.
Gross profi t dollars increased in fi scal 2011 primarily due to increased sales; however, gross profi t dollars increased at a lower rate than sales. This slower
growth in gross profi t dollars was primarily the result of two factors. First, based on Broadline’s product sales mix for fi scal 2011, it was most impacted
by higher levels of infl ation in the dairy, meat and seafood product categories in the range of 10% to 12%. Broadline’s largest selling product category,
canned and dry, experienced infl ation of 4%. Second, ongoing strategic pricing initiatives largely lowered our prices to our customers in certain product
categories in order to increase sales volumes. These initiatives are being phased in over time and resulted in short-term gross profi t declines as a percentage
of sales, but we believe will result in long-term gross profi t dollar growth due to higher sales volumes and increased market share. We have experienced
meaningful year over year volume growth with those items included in the early phases of these programs in the geographies where this program has been
implemented. We believe the long-term benefi ts of these strategic initiatives will result in profi table market share growth.
In addition, gross profi t dollars for fi scal 2011 increased as a result of higher fuel surcharges. Fuel surcharges were approximately $19.4million higher in
fi scal 2011 than the prior year due to the application of fuel surcharges to a broader customer base for a small portion of the third quarter and the entire
fourth quarter due to higher fuel prices incurred during these periods.
The expense increases in fi scal 2011 were driven largely by provisions for withdrawal from a multiemployer pension plan, an increase in pay-related
expenses and increased fuel costs. In fi scal 2011, we recorded provisions of $41.5million for withdrawal liabilities from multiemployer pension plans from
which union members elected to withdraw, compared to provisions of $2.9million in fi scal 2010. The increase in pay-related expenses was primarily due
to increased sales and delivery compensation. Portions of our pay-related expense are variable in nature and are expected to increase when sales and
gross profi t increase. Pay-related expenses from acquired companies and changes in the exchange rates used to translate our foreign sales into U.S.
dollars also contributed to the increase. Fuel costs were $22.0million higher in fi scal 2011 than the prior year.