Sysco 2012 Annual Report Download - page 34
Download and view the complete annual report
Please find page 34 of the 2012 Sysco annual report below. You can navigate through the pages in the report by either clicking on the pages listed below, or by using the keyword search tool below to find specific information within the annual report.-
 1
1 -
2
-
3
-
4
-
5
-
6
-
7
-
8
-
9
-
10
-
11
-
12
-
13
-
14
-
15
-
16
-
17
-
18
-
19
-
20
-
21
-
22
-
23
-
 24
24 -
 25
25 -
 26
26 -
 27
27 -
 28
28 -
 29
29 -
 30
30 -
 31
31 -
 32
32 -
 33
33 -
 34
34 -
 35
35 -
 36
36 -
 37
37 -
 38
38 -
 39
39 -
 40
40 -
 41
41 -
 42
42 -
 43
43 -
 44
44 -
45
-
46
-
47
-
48
-
49
-
50
-
51
-
52
-
53
-
54
-
55
-
56
-
57
-
58
-
59
-
60
-
61
-
62
-
63
-
64
-
65
-
66
-
67
-
68
-
69
-
70
-
71
-
72
-
73
-
74
-
75
-
76
-
77
-
78
-
79
-
80
-
81
-
82
-
83
-
84
-
85
-
86
-
87
-
88
-
89
-
90
-
91
-
92
-
93
-
94
-
95
-
96
-
97
-
98
-
99
-
100
-
101
-
102
-
103
-
104
-
105
-
106
-
107
-
108
-
109
-
110
-
111
 |
 |

SYSCO CORPORATION-Form10-K 11
PARTI
ITEM2Properties
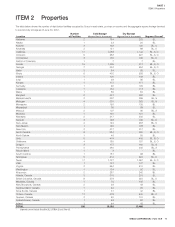
ITEM2 Properties
The table below shows the number of distribution facilities occupied by Sysco in each state, province or country and the aggregate square footage devoted
to cold and dry storage as of June30,2012.
Location
Number
ofFacilities
Cold Storage
(Square Feet in thousands)
Dry Storage
(Square Feet in thousands) Segment Served*
Alabama 2 184 228 BL
Alaska 1 43 26 BL
Arizona 3 138 120 BL, O
Arkansas 2 131 88 BL, O
California 17 1,088 1,144 BL, S, O
Colorado 5 283 227 BL, S, O
Connecticut 3 160 109 BL, O
District of Columbia 1 7 7 BL
Florida 15 1,269 911 BL, S, O
Georgia 7 324 454 BL, S, O
Idaho 2 84 88 BL
Illinois 6 402 535 BL, S, O
Indiana 1 100 109 BL
Iowa 1 93 95 BL
Kansas 1 177 171 BL
Kentucky 1 92 106 BL
Louisiana 1 134 113 BL
Maine 1 59 50 BL
Maryland 2 291 252 BL
Massachusetts 3 397 395 BL, S
Michigan 4 320 363 BL, S
Minnesota 2 150 135 BL
Mississippi 1 95 69 BL
Missouri 2 107 95 BL, S
Montana 1 120 121 BL
Nebraska 2 217 232 BL
Nevada 3 193 109 BL, O
New Jersey 4 140 453 BL, O
New Mexico 1 120 108 BL
NewYork 3 417 317 BL
North Carolina 6 334 300 BL, S, O
North Dakota 1 46 59 BL
Ohio 6 419 400 BL, S, O
Oklahoma 4 189 157 BL, S, O
Oregon 3 177 160 BL, S
Pennsylvania 4 460 405 BL, S
Rhode Island 1 3 - BL
South Carolina 1 151 98 BL
Tennessee 5 412 424 BL, O
Texas 17 1,127 1,057 BL, S, O
Utah 1 161 107 BL
Virginia 3 564 410 BL
Washington 1 134 92 BL
Wisconsin 2 287 242 BL
Alberta, Canada 3 218 216 BL
British Columbia, Canada 8 279 254 BL, O
Manitoba, Canada 1 76 105 BL
New Brunswick, Canada 2 48 48 BL
Newfoundland, Canada 1 40 25 BL
Nova Scotia, Canada 1 31 42 BL
Ontario, Canada 11 478 430 BL, O
Quebec, Canada 3 50 101 BL
Saskatchewan, Canada 1 46 63 BL
Ireland 1 44 40 BL
TOTAL 185 13,109 12,465
* Segments served include Broadline (BL), SYGMA (S) and Other (O).