Sysco 2012 Annual Report Download - page 41
Download and view the complete annual report
Please find page 41 of the 2012 Sysco annual report below. You can navigate through the pages in the report by either clicking on the pages listed below, or by using the keyword search tool below to find specific information within the annual report.-
 1
1 -
2
-
3
-
4
-
5
-
6
-
7
-
8
-
9
-
10
-
11
-
12
-
13
-
14
-
15
-
16
-
17
-
18
-
19
-
20
-
21
-
22
-
23
-
24
-
25
-
26
-
27
-
28
-
29
-
30
-
 31
31 -
 32
32 -
 33
33 -
 34
34 -
 35
35 -
 36
36 -
 37
37 -
 38
38 -
 39
39 -
 40
40 -
 41
41 -
 42
42 -
 43
43 -
 44
44 -
 45
45 -
 46
46 -
 47
47 -
 48
48 -
 49
49 -
 50
50 -
 51
51 -
52
-
53
-
54
-
55
-
56
-
57
-
58
-
59
-
60
-
61
-
62
-
63
-
64
-
65
-
66
-
67
-
68
-
69
-
70
-
71
-
72
-
73
-
74
-
75
-
76
-
77
-
78
-
79
-
80
-
81
-
82
-
83
-
84
-
85
-
86
-
87
-
88
-
89
-
90
-
91
-
92
-
93
-
94
-
95
-
96
-
97
-
98
-
99
-
100
-
101
-
102
-
103
-
104
-
105
-
106
-
107
-
108
-
109
-
110
-
111
 |
 |

SYSCO CORPORATION-Form10-K18
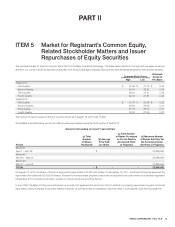
PARTII
ITEM7Management’s Discussion and Analysis of Financial Condition and Results of Operations
Our product cost reduction initiative is designed to lower our total product costs by $250million to $300million annually by fi scal 2015. This initiative
involves the use of market data and customer insights to make changes to product pricing and product assortment. We believe there are opportunities to
more effectively provide the products that our customers want, to benefi t from our purchasing power and to create mutually benefi cial partnerships with
our suppliers. We believe that procuring greater quantities with select vendors will result in reduced prices for our product purchases.
We expect our expenses related to the Business Transformation Project for fi scal 2013 to be approximately $300million to $350million net of benefi ts
obtained from our shared services center. We expect our capital expenditures related to this project to be approximately $5million to $20million. In fi scal
2013, we believe we can obtain approximately 25% of the total expected annualized benefi ts of $550million to $650million. If we are successful in obtaining
these benefi ts in fi scal 2013, some of the trends noted above could be favorably impacted.
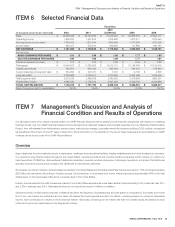
Results of Operations
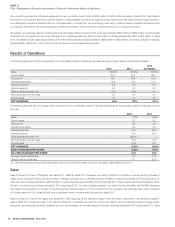
The following table sets forth the components of our consolidated results of operations expressed as a percentage of sales for the periods indicated:
2012 2011
2010
(53Weeks)
Sales 100.0% 100.0% 100.0%
Cost of sales 81.9 81.2 80.7
Gross profi t 18.1 18.8 19.3
Operating expenses 13.6 13.9 14.0
Operating income 4.5 4.9 5.3
Interest expense 0.3 0.3 0.3
Other expense (income), net (0.0) (0.0) 0.0
Earnings before income taxes 4.2 4.6 5.0
Income taxes 1.6 1.7 1.8
NET EARNINGS 2.6% 2.9% 3.2%
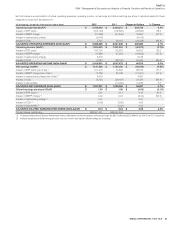
The following table sets forth the change in the components of our consolidated results of operations expressed as a percentage increase or decrease over the
prior year:
2012 2011
Sales 7.8% 5.6%
Cost of sales 8.7 6.2
Gross profi t 3.8 2.9
Operating expenses 5.9 4.8
Operating income (2.1) (2.2)
Interest expense (4.1) (5.7)
Other expense (income), net (52.4)(1) (1)
Earnings before income taxes (2.4) (1.2)
Income taxes (1.9) 0.9
NET EARNINGS (2.6)% (2.4)%
BASIC EARNINGS PER SHARE (2.6)% (1.5)%
DILUTED EARNINGS PER SHARE (3.1) (1.5)
Average shares outstanding 0.2 (1.0)
Diluted shares outstanding 0.1 (0.8)
(1) Other expense (income), net was income of $6.8million in fiscal 2012, income of $14.2million in fiscal 2011 and expense of $0.8million in fiscal 2010.
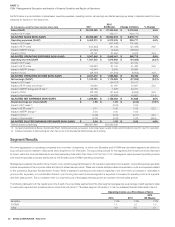
Sales
Sales for fi scal 2012 were 7.8% higher than fi scal 2011. Sales for fi scal 2012 increased as a result of product cost infl ation, and the resulting increase in
selling prices, along with improving case volumes. Changes in product cost, an internal measure of infl ation, were approximately 5.5% during fi scal 2012.
Case volumes including acquisitions within the last 12months improved approximately 3.0% during fi scal 2012. Case volumes excluding acquisitions within
the last 12months improved approximately 2.5% during fi scal 2012. Our case volumes represent our results from our Broadline and SYGMA segments
only. Sales from acquisitions in the last 12months favorably impacted sales by 0.7% for fi scal 2012. The changes in the exchange rates used to translate
our foreign sales into U.S. dollars did not have a signifi cant impact on sales when compared to fi scal 2011.
Sales for fi scal 2011 were 5.6% higher than fi scal 2010. After adjusting for the estimated impact of the 53rd week in fi scal 2010, the adjusted increase in
sales in fi scal 2011 would have been 7.7%. Sales for fi scal 2011 increased as a result of product cost infl ation, and the resulting increase in selling prices,
along with improving case volumes. Estimated product cost increases, an internal measure of infl ation, were approximately 4.6% during fi scal 2011. Case