Sysco 2012 Annual Report Download - page 61
Download and view the complete annual report
Please find page 61 of the 2012 Sysco annual report below. You can navigate through the pages in the report by either clicking on the pages listed below, or by using the keyword search tool below to find specific information within the annual report.-
 1
1 -
2
-
3
-
4
-
5
-
6
-
7
-
8
-
9
-
10
-
11
-
12
-
13
-
14
-
15
-
16
-
17
-
18
-
19
-
20
-
21
-
22
-
23
-
24
-
25
-
26
-
27
-
28
-
29
-
30
-
31
-
32
-
33
-
34
-
35
-
36
-
37
-
38
-
39
-
40
-
41
-
42
-
43
-
44
-
45
-
46
-
47
-
48
-
49
-
50
-
 51
51 -
 52
52 -
 53
53 -
 54
54 -
 55
55 -
 56
56 -
 57
57 -
 58
58 -
 59
59 -
 60
60 -
 61
61 -
 62
62 -
 63
63 -
 64
64 -
 65
65 -
 66
66 -
 67
67 -
 68
68 -
 69
69 -
 70
70 -
 71
71 -
72
-
73
-
74
-
75
-
76
-
77
-
78
-
79
-
80
-
81
-
82
-
83
-
84
-
85
-
86
-
87
-
88
-
89
-
90
-
91
-
92
-
93
-
94
-
95
-
96
-
97
-
98
-
99
-
100
-
101
-
102
-
103
-
104
-
105
-
106
-
107
-
108
-
109
-
110
-
111
 |
 |

SYSCO CORPORATION-Form10-K38
PARTII
ITEM7AQuantitative and Qualitative Disclosures About Market Risk
ITEM7A Quantitative and Qualitative Disclosures About
Market Risk
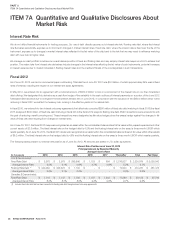
Interest Rate Risk
We do not utilize fi nancial instruments for trading purposes. Our use of debt directly exposes us to interest rate risk. Floating rate debt, where the interest
rate fl uctuates periodically, exposes us to short-term changes in market interest rates. Fixed rate debt, where the interest rate is fi xed over the life of the
instrument, exposes us to changes in market interest rates refl ected in the fair value of the debt and to the risk that we may need to refi nance maturing
debt with new debt at higher rates.
We manage our debt portfolio to achieve an overall desired position of fi xed and fl oating rates and may employ interest rate swaps as a tool to achieve that
position. The major risks from interest rate derivatives include changes in the interest rates affecting the fair value of such instruments, potential increases
in interest expense due to market increases in fl oating interest rates and the creditworthiness of the counterparties in such transactions.
Fiscal 2012
As of June30,2012, we had no commercial paper outstanding. Total debt as of June30,2012 was $3.0billion, of which approximately 84% was at fi xed
rates of interest, including the impact of our interest rate swap agreements.
In May2012, we entered into an agreement with a notional amount of $200.0million to lock in a component of the interest rate on our then forecasted
debt offering. We designated this derivative as a cash fl ow hedge of the variability in the cash outfl ows of interest payments on a portion of the June2012
forecasted debt issuance due to changes in the benchmark interest rate. In June2012, in conjunction with the issuance of the $450.0million senior notes
maturing in fi scal 2022, we settled the treasury lock, locking in the effective yields on the related debt.
In fi scal 2010, we entered into two interest rate swap agreements that effectively converted $250million of fi xed rate debt maturing in fi scal 2013 (the fi scal
2013 swap) and $200million of fi xed rate debt maturing in fi scal 2014 (the fi scal 2014 swap) to fl oating rate debt. Both transactions were entered into with
the goal of reducing overall borrowing cost. These transactions were designated as fair value hedges since the swaps hedge against the changes in fair
value of fi xed rate debt resulting from changes in interest rates.
As of June30,2012, the fi scal 2013 swap was recognized as an asset within the consolidated balance sheet at fair value within prepaid expenses and other
current assets of $2.5million. The fi xed interest rate on the hedged debt is 4.2% and the fl oating interest rate on the swap is three-month LIBOR which
resets quarterly. As of June30,2012, the fi scal 2014 swap was recognized as an asset within the consolidated balance sheet at fair value within other assets
of $6.2million. The fi xed interest rate on the hedged debt is 4.6% and the fl oating interest rate on the swap is three-month LIBOR which resets quarterly.
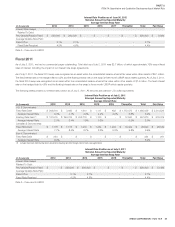
The following tables present our interest rate position as of June30,2012. All amounts are stated in U.S. dollar equivalents.
(In thousands)
Interest Rate Position as of June30,2012
Principal Amount by Expected Maturity
Average Interest Rate
2013 2014 2015 2016 2017 Thereafter Total Fair Value
U.S. $ Denominated:
Fixed Rate Debt $ 3,570 $ 2,979 $ 299,846 $ 1,153 $ 604 $ 2,216,827 $ 2,524,979 $ 3,030,042
Average Interest Rate 4.5% 4.1% 0.8% 4.7% 4.9% 5.2% 4.7%
Floating Rate Debt(1) $ 249,964 $ 206,673 $ 1,100 $ - $ - $ 12,500 $ 470,237 $ 481,475
Average Interest Rate 2.6% 2.1% 0.2% - - 0.5% 2.3%
Canadian $ Denominated:
Fixed Rate Debt $ 1,116 $ 1,147 $ 1,189 $ 1,187 $ 1,203 $ 17,280 $ 23,122 $ 27,746
Average Interest Rate 8.4% 8.7% 8.9% 9.3% 9.8% 9.7% 9.6%
(1) Includes fixed rate debt that has been converted to floating rate debt through interest rate swap agreements.