Sysco 2012 Annual Report Download - page 42
Download and view the complete annual report
Please find page 42 of the 2012 Sysco annual report below. You can navigate through the pages in the report by either clicking on the pages listed below, or by using the keyword search tool below to find specific information within the annual report.-
 1
1 -
2
-
3
-
4
-
5
-
6
-
7
-
8
-
9
-
10
-
11
-
12
-
13
-
14
-
15
-
16
-
17
-
18
-
19
-
20
-
21
-
22
-
23
-
24
-
25
-
26
-
27
-
28
-
29
-
30
-
31
-
 32
32 -
 33
33 -
 34
34 -
 35
35 -
 36
36 -
 37
37 -
 38
38 -
 39
39 -
 40
40 -
 41
41 -
 42
42 -
 43
43 -
 44
44 -
 45
45 -
 46
46 -
 47
47 -
 48
48 -
 49
49 -
 50
50 -
 51
51 -
 52
52 -
53
-
54
-
55
-
56
-
57
-
58
-
59
-
60
-
61
-
62
-
63
-
64
-
65
-
66
-
67
-
68
-
69
-
70
-
71
-
72
-
73
-
74
-
75
-
76
-
77
-
78
-
79
-
80
-
81
-
82
-
83
-
84
-
85
-
86
-
87
-
88
-
89
-
90
-
91
-
92
-
93
-
94
-
95
-
96
-
97
-
98
-
99
-
100
-
101
-
102
-
103
-
104
-
105
-
106
-
107
-
108
-
109
-
110
-
111
 |
 |
SYSCO CORPORATION-Form10-K 19
PARTII
ITEM7Management’s Discussion and Analysis of Financial Condition and Results of Operations
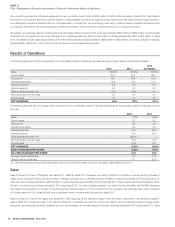
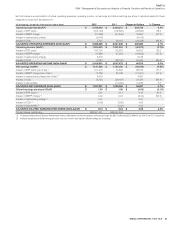
volumes including acquisitions within the last 12months improved approximately 4.1% during fi scal 2011. Case volumes excluding acquisitions within the
last 12months improved approximately 3.4% during fi scal 2011. Sales from acquisitions in the last 12months favorably impacted sales by 0.7% for fi scal
2011. The changes in the exchange rates used to translate our foreign sales into U.S. dollars positively impacted sales by 0.5% compared to fi scal 2010.
Operating Income
Cost of sales primarily includes our product costs, net of vendor consideration, and includes in-bound freight. Operating expenses include the costs of
facilities, product handling, delivery, selling and general and administrative activities. Fuel surcharges are refl ected within sales and gross profi t; fuel costs
are refl ected within operating expenses.
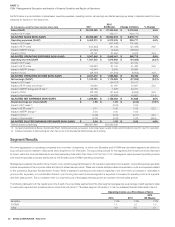
Fiscal 2012 vs. Fiscal 2011
Operating income decreased 2.1% in fi scal 2012 over fi scal 2011 to $1.9billion, and as a percentage of sales, decreased to 4.5% of sales. This decrease
was primarily driven by declines in gross margin and increased operating expenses partially from increased expenses from payroll and our Business
Transformation Project. These expense increases were partially offset by increases in gross profi t dollars. Gross profi t dollars increased 3.8% in fi scal 2012
as compared to fi scal 2011, and operating expenses increased 5.9% in fi scal 2012 as compared to fi scal 2011. Adjusted operating income increased
3.0%, or $60.9million, during fi scal 2012.
Gross profi t dollars increased in fi scal 2012 as compared to fi scal 2011 primarily due to increased sales. Gross margin, which is gross profi t as a percentage
of sales, was 18.11% in fi scal 2012, a decline of 69 basis points from the gross margin of 18.80% in fi scal 2011. This decline in gross margin was primarily
the result of product cost infl ation. Other factors contributing to our gross margin decline were competitive pressures on pricing, segment mix changes
where certain of our lower margin segments grew faster than our Broadline segment and our own strategy to gain market share.
Sysco’s product cost infl ation was estimated as infl ation of 5.5% during fi scal 2012. Based on our product sales mix for fi scal 2012, we were most impacted
by higher levels of infl ation in the meat, canned and dry and frozen product categories in the range of 6% to 8%. Our product cost infl ation reached a high
of 7.3% in the fi rst quarter of fi scal 2012 and a low of 3.3% in the fourth quarter of fi scal 2012. While we are generally able to pass through modest levels
of infl ation to our customers, we were unable to fully pass through these higher levels of product cost infl ation with the same gross margin in these product
categories without negatively impacting our customers’ business and therefore our business. In the summer months of 2012, certain agricultural areas
of the UnitedStates have experienced severe drought. The impact of this drought is uncertain and could result in volatile input costs. Input costs could
increase at any point in time for a large portion of the products that we sell for a prolonged period. While we cannot predict whether infl ation will continue
at these levels, prolonged periods of high infl ation, either overall or in certain product categories, can have a negative impact on us and our customers, as
high food costs can reduce consumer spending in the food-away-from-home market, and may negatively impact our sales, gross profi t and earnings. Our
product cost reduction initiative is designed to lower our total product costs by $250million to $300million annually by fi scal 2015; however we believe
the impact on our product costs in fi scal 2013 will be modest.
Gross profi t dollars for fi scal 2012 also increased as a result of higher fuel surcharges. Fuel surcharges were approximately $47.5million higher in fi scal
2012 than in fi scal 2011 due to higher fuel prices incurred during fi scal 2012 and the application of fuel surcharges to a broader customer base for the
entire fi scal period. Assuming that fuel prices do not greatly vary from recent levels, we expect the level of fuel surcharges in fi scal 2013 to remain consistent
with those experienced in fi scal 2012.
Operating expenses for fi scal 2012 increased 5.9% primarily due to increased pay-related expenses, increased expenses related to our Business Transformation
Project, increased fuel costs and an unfavorable year-over-year comparison on the amounts recorded to adjust the carrying value of COLI policies to their
cash surrender values as compared to the prior year period. These increases were partially offset by decreases in net company-sponsored pension costs
and lower provisions related to multiemployer pension plans. Adjusted operating expenses increased 4.1%, or $221.0million, in fi scal 2012 over fi scal 2011.
Pay-related expenses, excluding labor costs associated with our Business Transformation Project, increased by $153.7million in fi scal 2012 over fi scal
2011. The increase was primarily due to increased sales and delivery compensation and added costs from companies acquired within the last 12months.
Sales compensation includes commissions which are driven by gross profi t dollars and case volumes, and delivery compensation includes activity-based
pay which is driven by case volumes. Since these drivers are variable in nature, increased gross profi t dollars and cases volumes will increase sales and
delivery compensation. However, the impact of our productivity related initiatives could favorably impact the magnitude of this trend. Also contributing to
the increase was a restructuring charge related to severance incurred in the fourth quarter of fi scal 2012 of $6.4million.
Expenses related to our Business Transformation Project, inclusive of pay-related expense, were $193.1million in fi scal 2012 and $102.6million in fi scal
2011, representing an increase of $90.5million. The increase in fi scal 2012 resulted from increased project spending, reduced capitalization of expenditures
and expenses due to the ramp up of our shared services center. We anticipate that project expenses for fi scal 2013 will continue to increase primarily due
to the initiation of software amortization as the system was placed into service in August2012. Additionally, the majority of the expenditures forecasted for
fi scal 2013 will be expensed as the company is in the deployment phase of the project. We believe the increase in project expenses, including all pay-related
expenses, related to the Business Transformation Project in fi scal 2013 as compared to fi scal 2012 will be approximately $105million to $155million.