Sysco 2012 Annual Report Download - page 103
Download and view the complete annual report
Please find page 103 of the 2012 Sysco annual report below. You can navigate through the pages in the report by either clicking on the pages listed below, or by using the keyword search tool below to find specific information within the annual report.-
 1
1 -
2
-
3
-
4
-
5
-
6
-
7
-
8
-
9
-
10
-
11
-
12
-
13
-
14
-
15
-
16
-
17
-
18
-
19
-
20
-
21
-
22
-
23
-
24
-
25
-
26
-
27
-
28
-
29
-
30
-
31
-
32
-
33
-
34
-
35
-
36
-
37
-
38
-
39
-
40
-
41
-
42
-
43
-
44
-
45
-
46
-
47
-
48
-
49
-
50
-
51
-
52
-
53
-
54
-
55
-
56
-
57
-
58
-
59
-
60
-
61
-
62
-
63
-
64
-
65
-
66
-
67
-
68
-
69
-
70
-
71
-
72
-
73
-
74
-
75
-
76
-
77
-
78
-
79
-
80
-
81
-
82
-
83
-
84
-
85
-
86
-
87
-
88
-
89
-
90
-
91
-
92
-
 93
93 -
 94
94 -
 95
95 -
 96
96 -
 97
97 -
 98
98 -
 99
99 -
 100
100 -
 101
101 -
 102
102 -
 103
103 -
 104
104 -
 105
105 -
 106
106 -
 107
107 -
 108
108 -
 109
109 -
 110
110 -
 111
111
 |
 |

SYSCO CORPORATION-Form10-K80
PARTII
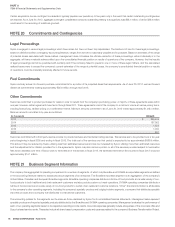
ITEM8Financial Statements and Supplementary Data
(In thousands)
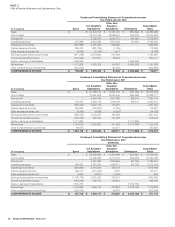
Condensed Consolidating Statement of Comprehensive Income
Year Ended June30,2012
Sysco
U.S. Broadline
Subsidiaries
Other Non-
Guarantor
Subsidiaries Eliminations
Consolidated
Totals
Sales $ - $ 29,100,106 $ 14,131,162 $ (850,329) $ 42,380,939
Cost of sales - 23,374,199 12,089,441 (759,278) 34,704,362
Gross profi t - 5,725,907 2,041,721 (91,051) 7,676,577
Operating expenses 527,888 3,534,382 1,814,726 (91,051) 5,785,945
Operating income (loss) (527,888) 2,191,525 226,995 - 1,890,632
Interest expense (income) 396,374 (281,193) (1,785) - 113,396
Other expense (income), net (6,993) (1,244) 1,471 - (6,766)
Earnings (losses) before income taxes (917,269) 2,473,962 227,309 - 1,784,002
Income tax (benefi t) provision (340,592) 918,607 84,402 - 662,417
Equity in earnings of subsidiaries 1,698,262 - - (1,698,262) -
Net earnings 1,121,585 1,555,355 142,907 (1,698,262) 1,121,585
Other comprehensive income (loss) (321,905) - (81,003) - (402,908)
COMPREHENSIVE INCOME $ 799,680 $ 1,555,355 $ 61,904 $ (1,698,262) $ 718,677
(In thousands)
Condensed Consolidating Statement of Comprehensive Income
Year Ended July2,2011
Sysco
U.S. Broadline
Subsidiaries
Other Non-
Guarantor
Subsidiaries Eliminations
Consolidated
Totals
Sales $ - $ 27,138,172 $ 12,861,426 $ (676,109) $ 39,323,489
Cost of sales - 21,591,829 10,923,446 (586,498) 31,928,777
Gross profi t - 5,546,343 1,937,980 (89,611) 7,394,712
Operating expenses 535,224 3,455,148 1,562,449 (89,611) 5,463,210
Operating income (loss) (535,224) 2,091,195 375,531 - 1,931,502
Interest expense (income) 453,593 (332,561) (2,765) - 118,267
Other expense (income), net (5,581) (4,636) (4,002) - (14,219)
Earnings (losses) before income taxes (983,236) 2,428,392 382,298 - 1,827,454
Income tax (benefi t) provision (363,403) 897,529 141,298 - 675,424
Equity in earnings of subsidiaries 1,771,863 - - (1,771,863) -
Net earnings 1,152,030 1,530,863 241,000 (1,771,863) 1,152,030
Other comprehensive income (loss) 98,076 - 122,217 - 220,293
COMPREHENSIVE INCOME $ 1,250,106 $ 1,530,863 $ 363,217 $ (1,771,863) $ 1,372,323
(In thousands)
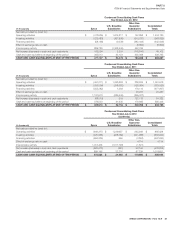
Condensed Consolidating Statement of Comprehensive Income
Year Ended July3,2010
(53Weeks)
Sysco
U.S. Broadline
Subsidiaries
Other Non-
Guarantor
Subsidiaries Eliminations
Consolidated
Totals
Sales $ - $ 25,966,566 $ 11,821,286 $ (544,357) $ 37,243,495
Cost of sales - 20,499,083 10,015,733 (459,628) 30,055,188
Gross profi t - 5,467,483 1,805,553 (84,729) 7,188,307
Operating expenses 500,823 3,342,934 1,453,411 (84,729) 5,212,439
Operating income (loss) (500,823) 2,124,549 352,142 - 1,975,868
Interest expense (income) 496,410 (374,203) 3,270 - 125,477
Other expense (income), net 5,546 (3,201) (1,543) - 802
Earnings (losses) before income taxes (1,002,779) 2,501,953 350,415 - 1,849,589
Income tax (benefi t) provision (363,029) 905,774 126,861 - 669,606
Equity in earnings of subsidiaries 1,819,733 - - (1,819,733) -
Net earnings 1,179,983 1,596,179 223,554 (1,819,733) 1,179,983
Other comprehensive income (loss) (252,238) - 49,973 - (202,265)
COMPREHENSIVE INCOME $ 927,745 $ 1,596,179 $ 273,527 $ (1,819,733) $ 977,718