Sysco 2012 Annual Report Download - page 105
Download and view the complete annual report
Please find page 105 of the 2012 Sysco annual report below. You can navigate through the pages in the report by either clicking on the pages listed below, or by using the keyword search tool below to find specific information within the annual report.-
 1
1 -
2
-
3
-
4
-
5
-
6
-
7
-
8
-
9
-
10
-
11
-
12
-
13
-
14
-
15
-
16
-
17
-
18
-
19
-
20
-
21
-
22
-
23
-
24
-
25
-
26
-
27
-
28
-
29
-
30
-
31
-
32
-
33
-
34
-
35
-
36
-
37
-
38
-
39
-
40
-
41
-
42
-
43
-
44
-
45
-
46
-
47
-
48
-
49
-
50
-
51
-
52
-
53
-
54
-
55
-
56
-
57
-
58
-
59
-
60
-
61
-
62
-
63
-
64
-
65
-
66
-
67
-
68
-
69
-
70
-
71
-
72
-
73
-
74
-
75
-
76
-
77
-
78
-
79
-
80
-
81
-
82
-
83
-
84
-
85
-
86
-
87
-
88
-
89
-
90
-
91
-
92
-
93
-
94
-
 95
95 -
 96
96 -
 97
97 -
 98
98 -
 99
99 -
 100
100 -
 101
101 -
 102
102 -
 103
103 -
 104
104 -
 105
105 -
 106
106 -
 107
107 -
 108
108 -
 109
109 -
 110
110 -
 111
111
 |
 |

SYSCO CORPORATION-Form10-K82
PARTII
ITEM8Financial Statements and Supplementary Data
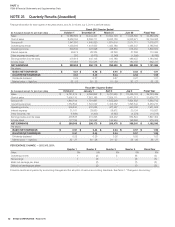
NOTE23 Quarterly Results (Unaudited)
Financial information for each quarter in the years ended June30,2012 and July2,2011 is set forth below:
(In thousands except for per share data)
Fiscal 2012 Quarter Ended
Fiscal YearOctober1 December31 March31 June30
Sales $ 10,586,390 $ 10,244,421 $ 10,504,746 $ 11,045,382 $ 42,380,939
Cost of sales 8,638,790 8,398,771 8,633,130 9,033,671 34,704,362
Gross profi t 1,947,600 1,845,650 1,871,616 2,011,711 7,676,577
Operating expenses 1,438,260 1,418,652 1,432,786 1,496,247 5,785,945
Operating income 509,340 426,998 438,830 515,464 1,890,632
Interest expense 29,474 28,324 28,290 27,308 113,396
Other expense (income), net 250 (3,472) (2,248) (1,296) (6,766)
Earnings before income taxes 479,616 402,146 412,788 489,452 1,784,002
Income taxes 176,963 152,033 153,238 180,183 662,417
NET EARNINGS $ 302,653 $ 250,113 $ 259,550 $ 309,269 $ 1,121,585
Per share:
BASIC NET EARNINGS $ 0.51 $ 0.43 $ 0.44 $ 0.53 $ 1.91
DILUTED NET EARNINGS 0.51 0.43 0.44 0.53 1.90
Dividends declared 0.26 0.27 0.27 0.27 1.07
Market price— high/low 32 - 25 30 - 25 31 - 29 30 - 27 32 - 25
(In thousands except for per share data)
Fiscal 2011 Quarter Ended
Fiscal YearOctober2 January1 April2 July2
Sales $ 9,751,274 $ 9,384,852 $ 9,761,660 $ 10,425,703 $ 39,323,489
Cost of sales 7,905,170 7,623,185 7,929,111 8,471,311 31,928,777
Gross profi t 1,846,104 1,761,667 1,832,549 1,954,392 7,394,712
Operating expenses 1,339,864 1,324,642 1,405,062 1,393,642 5,463,210
Operating income 506,240 437,025 427,487 560,750 1,931,502
Interest expense 31,101 28,060 28,972 30,134 118,267
Other (income), net (1,684) (1,300) (6,957) (4,278) (14,219)
Earnings before income taxes 476,823 410,265 405,472 534,894 1,827,454
Income taxes 177,754 152,092 146,994 198,584 675,424
NET EARNINGS $ 299,069 $ 258,173 $ 258,478 $ 336,310 $ 1,152,030
Per share:
BASIC NET EARNINGS $ 0.51 $ 0.44 $ 0.44 $ 0.57 $ 1.96
DILUTED NET EARNINGS 0.51 0.44 0.44 0.57 1.96
Dividends declared 0.25 0.26 0.26 0.26 1.03
Market price— high/low 32 - 27 30 - 28 31 - 27 33 - 28 33 - 27
PERCENTAGE CHANGE — 2012 VS. 2011:
Quarter 1 Quarter 2 Quarter 3 Quarter 4 Fiscal Year
Sales 9% 9% 8% 6% 8%
Operating income 1 (2) 3 (8) (2)
Net earnings 1 (3) - (8) (3)
Basic net earnings per share - (2) - (7) (3)
Diluted net earnings per share - (2) - (7) (3)
Financial results are impacted by accounting changes and the adoption of various accounting standards. See Note2, “Changes in Accounting.”