Sysco 2012 Annual Report Download - page 37
Download and view the complete annual report
Please find page 37 of the 2012 Sysco annual report below. You can navigate through the pages in the report by either clicking on the pages listed below, or by using the keyword search tool below to find specific information within the annual report.-
 1
1 -
2
-
3
-
4
-
5
-
6
-
7
-
8
-
9
-
10
-
11
-
12
-
13
-
14
-
15
-
16
-
17
-
18
-
19
-
20
-
21
-
22
-
23
-
24
-
25
-
26
-
 27
27 -
 28
28 -
 29
29 -
 30
30 -
 31
31 -
 32
32 -
 33
33 -
 34
34 -
 35
35 -
 36
36 -
 37
37 -
 38
38 -
 39
39 -
 40
40 -
 41
41 -
 42
42 -
 43
43 -
 44
44 -
 45
45 -
 46
46 -
 47
47 -
48
-
49
-
50
-
51
-
52
-
53
-
54
-
55
-
56
-
57
-
58
-
59
-
60
-
61
-
62
-
63
-
64
-
65
-
66
-
67
-
68
-
69
-
70
-
71
-
72
-
73
-
74
-
75
-
76
-
77
-
78
-
79
-
80
-
81
-
82
-
83
-
84
-
85
-
86
-
87
-
88
-
89
-
90
-
91
-
92
-
93
-
94
-
95
-
96
-
97
-
98
-
99
-
100
-
101
-
102
-
103
-
104
-
105
-
106
-
107
-
108
-
109
-
110
-
111
 |
 |
SYSCO CORPORATION-Form10-K14
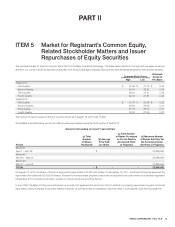
PARTII
ITEM5Market for Registrant’s Common Equity, Related Stockholder Matters andIssuer Repurchasesof Equity Securities
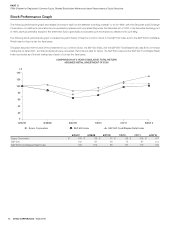
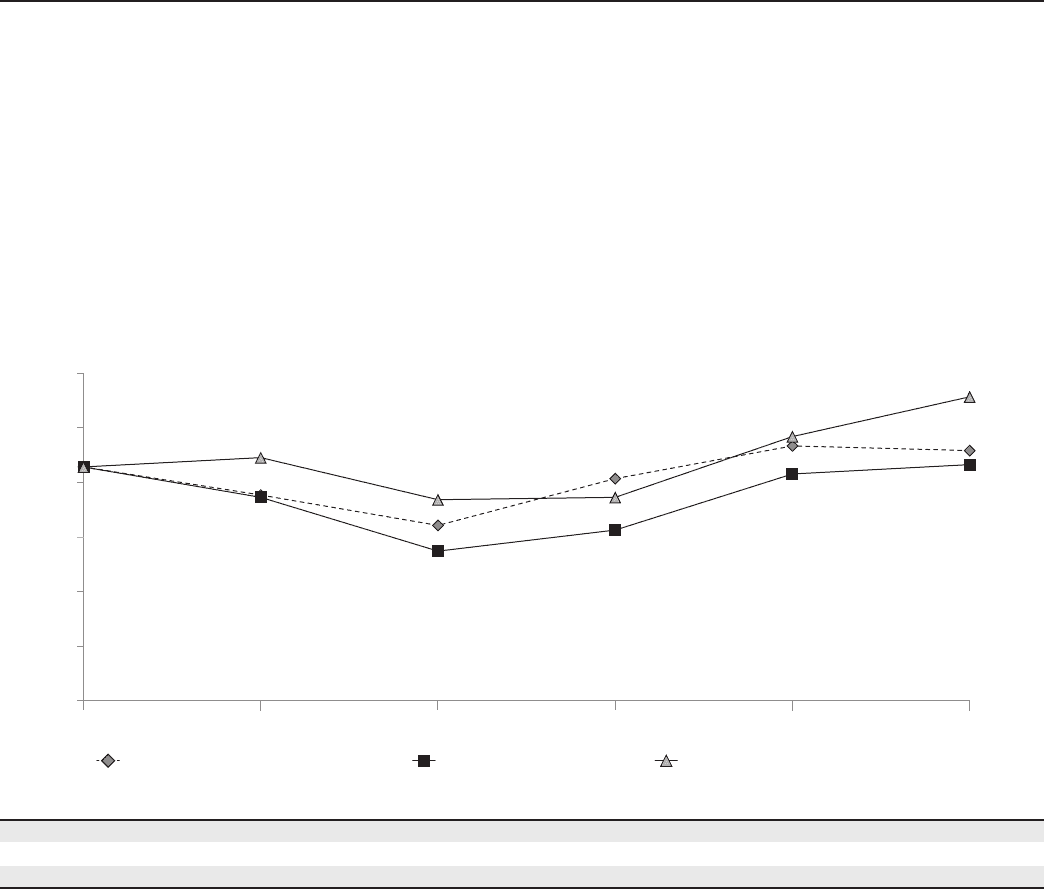
Stock Performance Graph
The following performance graph and related information shall not be deemed “soliciting material” or to be “fi led” with the Securities and Exchange
Commission, nor shall such information be incorporated by reference into any future fi ling under the Securities Act of 1933 or the Securities Exchange Act
of 1934, each as amended, except to the extent that Sysco specifi cally incorporates such information by reference into such fi ling.
The following stock performance graph compares the performance of Sysco’s Common Stock to the S&P 500 Index and to the S&P 500 Food/Staple
Retail Index for Sysco’s last fi ve fi scal years.
The graph assumes that the value of the investment in our Common Stock, the S&P 500 Index, and the S&P 500 Food/Staple Index was $100 on the last
trading day of fi scal 2007, and that all dividends were reinvested. Performance data for Sysco, the S&P 500 Index and the S&P 500 Food/Staple Retail
Index is provided as of the last trading day of each of our last fi ve fi scal years.
COMPARISON OF 5 YEAR CUMULATIVE TOTAL RETURN
ASSUMES INITIAL INVESTMENT OF $100
6/30/07 7/3/106/27/096/28/08 7/2/11 6/30/12
In $
0
20
40
60
80
100
120
140
S&P 500 IndexSysco Corporation S&P 500 Food/Staples Retail Index
6/30/07 6/28/08 6/27/09 7/3/10 7/2/11 6/30/12
Sysco Corporation $ 100 $ 88 $ 75 $ 95 $ 109 $ 107
S&P 500 100 87 64 73 97 101
S&P 500 Food/Staples Retail Index 100 104 86 87 113 130