Sysco 2012 Annual Report Download - page 79
Download and view the complete annual report
Please find page 79 of the 2012 Sysco annual report below. You can navigate through the pages in the report by either clicking on the pages listed below, or by using the keyword search tool below to find specific information within the annual report.-
 1
1 -
2
-
3
-
4
-
5
-
6
-
7
-
8
-
9
-
10
-
11
-
12
-
13
-
14
-
15
-
16
-
17
-
18
-
19
-
20
-
21
-
22
-
23
-
24
-
25
-
26
-
27
-
28
-
29
-
30
-
31
-
32
-
33
-
34
-
35
-
36
-
37
-
38
-
39
-
40
-
41
-
42
-
43
-
44
-
45
-
46
-
47
-
48
-
49
-
50
-
51
-
52
-
53
-
54
-
55
-
56
-
57
-
58
-
59
-
60
-
61
-
62
-
63
-
64
-
65
-
66
-
67
-
68
-
 69
69 -
 70
70 -
 71
71 -
 72
72 -
 73
73 -
 74
74 -
 75
75 -
 76
76 -
 77
77 -
 78
78 -
 79
79 -
 80
80 -
 81
81 -
 82
82 -
 83
83 -
 84
84 -
 85
85 -
 86
86 -
 87
87 -
 88
88 -
 89
89 -
90
-
91
-
92
-
93
-
94
-
95
-
96
-
97
-
98
-
99
-
100
-
101
-
102
-
103
-
104
-
105
-
106
-
107
-
108
-
109
-
110
-
111
 |
 |

SYSCO CORPORATION-Form10-K56
PARTII
ITEM8Financial Statements and Supplementary Data
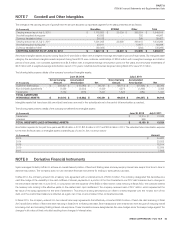
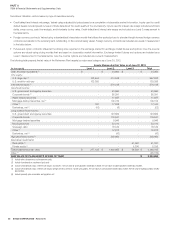
The location and the fair value of derivative instruments in the consolidated balance sheet as of each fi scal year-end are as follows:
(In thousands)
Asset Derivatives Liability Derivatives
Balance Sheet Location Fair Value Balance Sheet Location Fair Value
Fair Value Hedge Relationships:
Interest rate swap agreements
June30,2012
Prepaid expenses and
other current assets $ 2,475 N/A N/A
June30,2012 Other assets 6,219 N/A N/A
July2,2011 Other assets 13,482 N/A N/A
The location and effect of derivative instruments and related hedged items on consolidated comprehensive income for each fi scal year presented on a pre-tax
basis are as follows:
(In thousands)
Location of (Gain) or Loss
Recognized in Income
Amount of (Gain) or Loss
Recognized in Income
2012 2011
2010
(53Weeks)
Fair Value Hedge Relationships:
Interest rate swap agreements Interest expense $ (7,900) $ (9,026) $ (10,557)
Cash Flow Hedge Relationships:
Treasury lock agreement Other comprehensive income (722) N/A N/A
Interest rate contracts Interest expense 692 696 695
Hedge ineffectiveness represents the difference between the changes in the fair value of the derivative instruments and the changes in fair value of the
fi xed rate debt attributable to changes in the benchmark interest rate. Hedge ineffectiveness is recorded directly in earnings within interest expense and
was immaterial for fi scal 2012, fi scal 2011 and fi scal 2010. The interest rate swaps do not contain credit-risk-related contingent features.
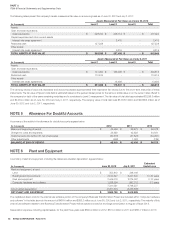
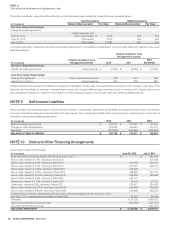
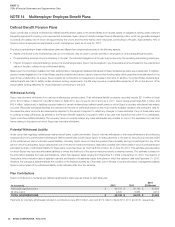
NOTE9 Self-Insured Liabilities
Sysco maintains a self-insurance program covering portions of workers’ compensation, general and vehicle liability and property insurance costs. The amounts
in excess of the self-insured levels are fully insured by third party insurers. The company also maintains a fully self-insured group medical program. A summary of
the activity in self-insured liabilities appears below:
(In thousands)
2012 2011 2010
Balance at beginning of period $ 129,671 $ 128,997 $ 132,551
Charged to costs and expenses 318,828 325,540 321,373
Payments (318,750) (324,866) (324,927)
BALANCE AT END OF PERIOD $ 129,749 $ 129,671 $ 128,997
NOTE10 Debt and Other Financing Arrangements
Sysco’s debt consists of the following:
(In thousands)
June30,2012 July2,2011
Short-term bank borrowings, interest at 2.0% as of July2,2011 $ - $ 181,975
Senior notes, interest at 6.1%, maturing in fi scal 2012 - 200,092
Senior notes, interest at 4.2%, maturing in fi scal 2013 249,964 253,316
Senior notes, interest at 4.6%, maturing in fi scal 2014 206,673 208,779
Senior notes, interest at 0.55%, maturing in fi scal 2015 297,983 -
Senior notes, interest at 5.25%, maturing in fi scal 2018 498,069 497,724
Senior notes, interest at 5.375%, maturing in fi scal 2019 248,862 248,693
Senior notes, interest at 2.6%, maturing in fi scal 2022 444,271 -
Debentures, interest at 7.16%, maturing in fi scal 2027 50,000 50,000
Debentures, interest at 6.5%, maturing in fi scal 2029 224,617 224,593
Senior notes, interest at 5.375%, maturing in fi scal 2036 499,654 499,639
Senior notes, interest at 6.625%, maturing in fi scal 2039 245,685 245,524
Industrial Revenue Bonds, capital leases and other debt, interest averaging 5.9% as of June30,2012
andJuly2,2011, maturing at various dates to fi scal 2026 52,560 58,188
Total debt 3,018,338 2,668,523
Less current maturities of long-term debt (254,650) (207,031)
Less short-term bank borrowings - (181,975)
NET LONG-TERM DEBT $ 2,763,688 $ 2,279,517