Sysco 2012 Annual Report Download - page 91
Download and view the complete annual report
Please find page 91 of the 2012 Sysco annual report below. You can navigate through the pages in the report by either clicking on the pages listed below, or by using the keyword search tool below to find specific information within the annual report.-
 1
1 -
2
-
3
-
4
-
5
-
6
-
7
-
8
-
9
-
10
-
11
-
12
-
13
-
14
-
15
-
16
-
17
-
18
-
19
-
20
-
21
-
22
-
23
-
24
-
25
-
26
-
27
-
28
-
29
-
30
-
31
-
32
-
33
-
34
-
35
-
36
-
37
-
38
-
39
-
40
-
41
-
42
-
43
-
44
-
45
-
46
-
47
-
48
-
49
-
50
-
51
-
52
-
53
-
54
-
55
-
56
-
57
-
58
-
59
-
60
-
61
-
62
-
63
-
64
-
65
-
66
-
67
-
68
-
69
-
70
-
71
-
72
-
73
-
74
-
75
-
76
-
77
-
78
-
79
-
80
-
 81
81 -
 82
82 -
 83
83 -
 84
84 -
 85
85 -
 86
86 -
 87
87 -
 88
88 -
 89
89 -
 90
90 -
 91
91 -
 92
92 -
 93
93 -
 94
94 -
 95
95 -
 96
96 -
 97
97 -
 98
98 -
 99
99 -
 100
100 -
 101
101 -
102
-
103
-
104
-
105
-
106
-
107
-
108
-
109
-
110
-
111
 |
 |

SYSCO CORPORATION-Form10-K68
PARTII
ITEM8Financial Statements and Supplementary Data
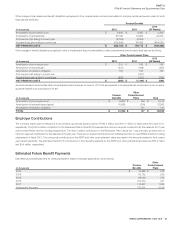
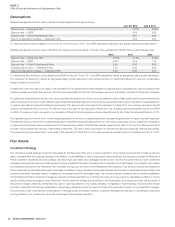
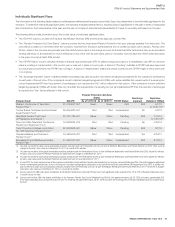
The following table provides information about the company’s contributions to individually signifi cant plans:
•The “Sysco Contributions” columns provide contribution amounts based on Sysco’s fi scal years, which may not coincide with the plans’ fi scal years.
•
The “Sysco 5% of Total Plan Contributions” columns indicate whether Sysco was listed in the plan’s most recently fi led Form5500s as providing more
than fi ve percent of the total contributions to the plan, and the plan year-end is noted. As of the date these fi nancial statements were fi led with the SEC,
Form5500s were not available for plan years ending December31,2011.
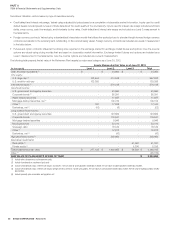
Pension Fund
(In thousands)
Sysco Contributions
Sysco 5% of Total Plan
Contributions
2012 2011
2010
(53Weeks)
Year Ending
12/31/10
Year Ending
12/31/09
Western Conference of Teamsters Pension Plan $ 19,829 $ 19,490 $ 19,051 No No
Central States, Southeast and Southwest Areas Pension Fund 33,032 1,835 19,795 No No
Teamsters Pension Trust Fund of Philadelphia and Vicinity 2,227 2,009 1,922 No No
NewYork State Teamsters Conference Pension
and Retirement Fund
1,395 1,366 1,449 No No
Truck Drivers and Helpers Local Union No.355 Retirement
Pension Fund
1,490 1,358 1,397 Yes Yes
Cleveland Bakers and Teamsters Pension Fund 1,189 1,149 1,027 Yes No
Minneapolis Food Distributing Industry Pension Plan 4,556 2,973 2,842 Yes Yes
For all of the plans noted in the table above, minimum contributions outside of the agreed upon contractual rate are not required.
Other Postretirement Benefi t Plans
In addition to the contributions to the defi ned benefi t pension plans described above, Sysco also contributes to several multiemployer plans that provide
other postretirement benefi ts based on obligations arising under collective bargaining agreements covering union-represented employees. These plans may
provide medical, pharmacy, dental, vision, mental health and other benefi ts to active employees and retirees as determined by the trustees of each plan.
Sysco contributed to these plans $25.5million in fi scal 2012, $23.9million in fi scal 2011 and $22.7million in fi scal 2010. There have been no signifi cant
changes that affect the comparability of fi scal 2012, fi scal 2011 and fi scal 2010 contributions.
NOTE15 Earnings Per Share
Basic earnings per share has been computed by dividing net earnings by the weighted average number ofshares of common stock outstanding for
each respective year. Diluted earnings per share has been computed by dividing net earnings by the weighted average number ofshares of common
stock outstanding during those respective years adjusted for the dilutive effect of share-based awards outstanding using the treasury stock method. The
two-class method is also utilized for the computation of earnings per share. The two-class method requires a portion of net income to be allocated to
participating securities, which are unvested awards of share-based compensation with non-forfeitable rights to receive dividends or dividend equivalents,
if declared. Net earnings allocated to these participating securities are excluded from net earnings allocated to commonshares and were insignifi cant in
fi scal 2012,2011 and 2010.
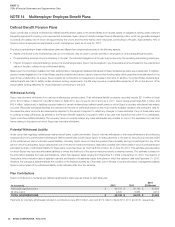
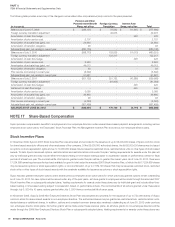
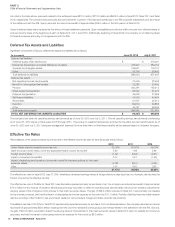
A reconciliation of the numerators and the denominators of the basic and diluted earnings per share computations for the periods presented follows:
(In thousands, except for share and per share data)
2012 2011
2010
(53Weeks)
Numerator:
Net earnings $ 1,121,585 $ 1,152,030 $ 1,179,983
Denominator:
Weighted-average basicshares outstanding 587,726,343 586,526,142 592,157,221
Dilutive effect of share-based awards 1,265,098 2,165,404 1,432,821
Weighted-average dilutedshares outstanding 588,991,441 588,691,546 593,590,042
BASIC EARNINGS PER SHARE: $ 1.91 $ 1.96 $ 1.99
DILUTED EARNINGS PER SHARE: $ 1.90 $ 1.96 $ 1.99
The number of options that were not included in the diluted earnings per share calculation because the effect would have been anti-dilutive was approximately
49,100,000, 50,700,000 and 58,200,000 for fi scal 2012,2011 and 2010, respectively.
Dividends declared were $628.0million, $604.5million and $585.7million in fi scal 2012,2011 and 2010, respectively. Included in dividends declared for
each year were dividends declared but not yet paid at year-end of approximately $159.4million, $155.0million and $148.0million in fi scal 2012,2011
and 2010, respectively.