Sysco 2012 Annual Report Download - page 46
Download and view the complete annual report
Please find page 46 of the 2012 Sysco annual report below. You can navigate through the pages in the report by either clicking on the pages listed below, or by using the keyword search tool below to find specific information within the annual report.-
 1
1 -
2
-
3
-
4
-
5
-
6
-
7
-
8
-
9
-
10
-
11
-
12
-
13
-
14
-
15
-
16
-
17
-
18
-
19
-
20
-
21
-
22
-
23
-
24
-
25
-
26
-
27
-
28
-
29
-
30
-
31
-
32
-
33
-
34
-
35
-
 36
36 -
 37
37 -
 38
38 -
 39
39 -
 40
40 -
 41
41 -
 42
42 -
 43
43 -
 44
44 -
 45
45 -
 46
46 -
 47
47 -
 48
48 -
 49
49 -
 50
50 -
 51
51 -
 52
52 -
 53
53 -
 54
54 -
 55
55 -
 56
56 -
57
-
58
-
59
-
60
-
61
-
62
-
63
-
64
-
65
-
66
-
67
-
68
-
69
-
70
-
71
-
72
-
73
-
74
-
75
-
76
-
77
-
78
-
79
-
80
-
81
-
82
-
83
-
84
-
85
-
86
-
87
-
88
-
89
-
90
-
91
-
92
-
93
-
94
-
95
-
96
-
97
-
98
-
99
-
100
-
101
-
102
-
103
-
104
-
105
-
106
-
107
-
108
-
109
-
110
-
111
 |
 |
SYSCO CORPORATION-Form10-K 23
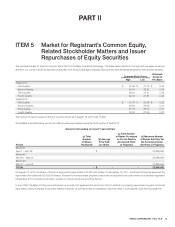
PARTII
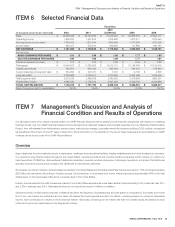
ITEM7Management’s Discussion and Analysis of Financial Condition and Results of Operations
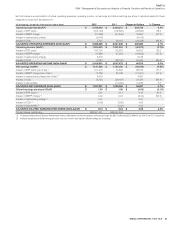
Set forth below is a reconciliation of actual operating expenses, operating income, net earnings and diluted earnings per share to adjusted results for these
measures for fi scal 2012 and fi scal 2011:
(In thousands, except for share and per share data)
2012 2011 Change in Dollars % Change
Operating expenses (GAAP) $ 5,785,945 $ 5,463,210 $ 322,735 5.9%
Impact of BTP costs (193,126) (102,623) (90,503) 88.2
Impact of MEPP charge (21,899) (41,544) 19,645 (47.3)
Impact of restructuring charge (6,415) - (6,415)
Impact of COLI 3,721 28,197 (24,476) (86.8)
ADJUSTED OPERATING EXPENSES (NON-GAAP) $ 5,568,226 $ 5,347,240 $ 220,986 4.1%
Operating Income (GAAP) $ 1,890,632 $ 1,931,502 $ (40,870) (2.1)%
Impact of BTP costs 193,126 102,623 90,503 88.2
Impact of MEPP charge 21,899 41,544 (19,645) (47.3)
Impact of restructuring charge 6,415 - 6,415
Impact of COLI (3,721) (28,197) 24,476 (86.8)
ADJUSTED OPERATING INCOME (NON-GAAP) $ 2,108,351 $ 2,047,472 $ 60,879 3.0%
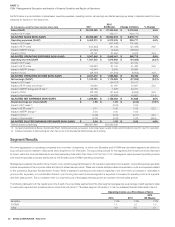
Net earnings (GAAP) $ 1,121,585 $ 1,152,030 $ (30,445) (2.6)%
Impact of BTP costs (net of tax)(1) 121,416 64,694 56,722 87.7
Impact of MEPP charge (net of tax)(1) 13,768 26,189 (12,421) (47.4)
Impact of restructuring charge (net of tax)(1) 4,033 - 4,033
Impact of COLI (3,721) (28,197) 24,476 (86.8)
Impact of tax benefi ts - (14,032) 14,032 0.0
ADJUSTED NET EARNINGS (NON-GAAP) $ 1,257,081 $ 1,200,684 $ 56,397 4.7%
Diluted earnings per share (GAAP) $ 1.90 $ 1.96 $ (0.06) (3.1)%
Impact of BTP costs(2) 0.21 0.11 0.10 90.9
Impact of MEPP charge(2) 0.02 0.04 (0.02) (50.0)
Impact of restructuring charge(2) 0.01 - 0.01
Impact of COLI(2) (0.00) (0.05) 0.05
Impact of tax benefi ts(2) - (0.02) 0.02
ADJUSTED DILUTED EARNINGS PER SHARE (NON-GAAP) $ 2.13 $ 2.04 $ 0.09 4.4%
Diluted shares outstanding 588,991,441 588,691,546
(1) Tax impact of adjustments for Business Transformation Project, multiemployer pension plan expenses, restructuring charges was $82.2million and $53.3million for fiscal 2012 and 2011, respectively.
(2) Individual components of diluted earnings per share may not sum to the total adjusted diluted earnings due to rounding.