Sysco 2012 Annual Report Download - page 43
Download and view the complete annual report
Please find page 43 of the 2012 Sysco annual report below. You can navigate through the pages in the report by either clicking on the pages listed below, or by using the keyword search tool below to find specific information within the annual report.-
 1
1 -
2
-
3
-
4
-
5
-
6
-
7
-
8
-
9
-
10
-
11
-
12
-
13
-
14
-
15
-
16
-
17
-
18
-
19
-
20
-
21
-
22
-
23
-
24
-
25
-
26
-
27
-
28
-
29
-
30
-
31
-
32
-
 33
33 -
 34
34 -
 35
35 -
 36
36 -
 37
37 -
 38
38 -
 39
39 -
 40
40 -
 41
41 -
 42
42 -
 43
43 -
 44
44 -
 45
45 -
 46
46 -
 47
47 -
 48
48 -
 49
49 -
 50
50 -
 51
51 -
 52
52 -
 53
53 -
54
-
55
-
56
-
57
-
58
-
59
-
60
-
61
-
62
-
63
-
64
-
65
-
66
-
67
-
68
-
69
-
70
-
71
-
72
-
73
-
74
-
75
-
76
-
77
-
78
-
79
-
80
-
81
-
82
-
83
-
84
-
85
-
86
-
87
-
88
-
89
-
90
-
91
-
92
-
93
-
94
-
95
-
96
-
97
-
98
-
99
-
100
-
101
-
102
-
103
-
104
-
105
-
106
-
107
-
108
-
109
-
110
-
111
 |
 |
SYSCO CORPORATION-Form10-K20
PARTII
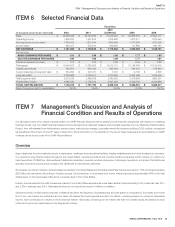
ITEM7Management’s Discussion and Analysis of Financial Condition and Results of Operations
Fuel costs increased by $39.8million in fi scal 2012 over fi scal 2011 primarily due to increased contracted and market diesel prices. Our costs per gallon
increased 13.0% in fi scal 2012 over fi scal 2011. Our activities to mitigate fuel costs include reducing miles driven by our trucks through improved routing
techniques, improving fl eet utilization by adjusting idling time and maximum speeds and using fuel surcharges. We routinely enter into forward purchase
commitments for a portion of our projected monthly diesel fuel requirements with a goal of mitigating a portion of the volatility in fuel prices.
Our fuel commitments will result in either additional fuel costs or avoided fuel costs based on the comparison of the prices on the fi xed price contracts
and market prices for the respective periods. In fi scal 2012, the forward purchase commitments resulted in an estimated $20.2million of avoided fuel
costs as the fi xed price contracts were generally lower than market prices for the contracted volumes. In fi scal 2011, the forward purchase commitments
resulted in an estimated $16.4million of avoided fuel costs as the fi xed price contracts were generally lower than market prices for the contracted volumes.
As of June30,2012, we had forward diesel fuel commitments totaling approximately $96million through April2013. Subsequent to June30,2012, we
entered into forward diesel fuel commitments totaling approximately $20million for Mayand June2013. These contracts will lock in the price of approximately
35% to 45% of our fuel purchase needs for the contracted periods at prices higher than the current market price for diesel. Assuming that fuel prices do not
rise signifi cantly over recent levels during fi scal 2013, fuel costs exclusive of any amounts recovered through fuel surcharges, are not expected to fl uctuate
signifi cantly as compared to fi scal 2012. Our estimate is based upon current, published quarterly market price projections for diesel, the cost committed to
in our forward fuel purchase agreements currently in place for fi scal 2013 and estimates of fuel consumption. Actual fuel costs could vary from our estimates
if any of these assumptions change, in particular if future fuel prices vary signifi cantly from our current estimates. We continue to evaluate all opportunities
to offset potential increases in fuel expense, including the use of fuel surcharges and overall expense management.
We adjust the carrying values of our COLI policies to their cash surrender values on an ongoing basis. The cash surrender values of these policies are
largely based on the values of underlying investments, which through fi scal 2011 included publicly traded securities. As a result, the cash surrender values
of these policies fl uctuated with changes in the market value of such securities. The changes in the fi nancial markets resulted in gains for these policies of
$28.2million in fi scal 2011. Near the end of fi scal 2011, we reallocated all of our policies into low-risk, fi xed-income securities to reduce earnings volatility
and therefore our adjustments for fi scal 2012 were not signifi cant. Beginning with fi scal 2013, there should be no signifi cant year-over-year impact from
COLI adjustments as compared to fi scal 2013.
Net company-sponsored pension costs in fi scal 2012 were $27.3million lower than in fi scal 2011. The decrease in fi scal 2012 was due primarily to higher
returns on assets of Sysco’s Retirement Plan obtained in fi scal 2011. At the end of fi scal 2012, Sysco decided to freeze future benefi t accruals under the
Retirement Plan as of December31,2012 for all U.S.-based salaried and non-union hourly employees. Effective January1,2013, these employees will
be eligible for additional contributions under an enhanced, defi ned contribution plan. Net company-sponsored pension costs in fi scal 2013 have been
determined as of the fi scal 2012 year-end measurement date and will decrease by approximately $26.5million in fi scal 2013. Our expenses related to
our defi ned contribution plan will increase approximately $45million to $55million in fi scal 2013. The decline in pension cost will occur evenly over fi scal
2013; however, the increased defi ned contribution expenses will occur in the last half of fi scal 2013 when these enhancements go into effect. Over the
long-term, we believe the changes to both plans will result in reduced volatility of retirement related expenses and a reduction in total retirement related
expenses. Absent the Retirement Plan freeze discussed above, net company-sponsored pension costs in fi scal 2013 would have increased $106.9million
instead of decreasing $26.5million.
From time to time, we may voluntarily withdraw from multiemployer pension plans to minimize or limit our future exposure to these plans. In the last two
fi scal years, we voluntary withdrew from several multiemployer plans and recorded provisions of $21.9million in fi scal 2012 and $41.5million in fi scal 2011.
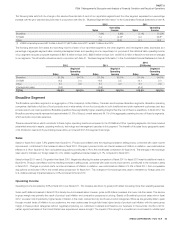
We also measure our expense performance on a cost per case basis, which we seek to align with the gross profi t that we are able to generate. For our
Broadline companies, our cost per case increased $0.04 per case as compared to fi scal 2011. These increases primarily related to increased payroll costs
and fuel costs discussed above.
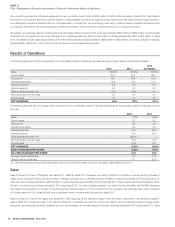
Fiscal 2011 vs. Fiscal 2010
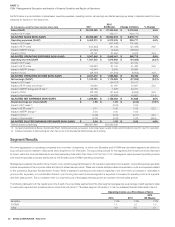
Operating income decreased 2.2% in fi scal 2011 over fi scal 2010 to $1.9billion, and as a percentage of sales, declined to 4.9% of sales. The decrease
was driven by the absence of the 53
rd
week in fi scal 2011, gross profi t dollars growing at a slower rate than sales and operating expenses increasing faster
than gross profi t partially due to charge of $41.5million from withdrawals from multiemployer pension plans. Gross profi t dollars increased 2.9% in fi scal
2011 as compared to fi scal 2010, and operating expenses increased 4.8% in fi scal 2011. Adjusted operating income increased 2.5%, or $50.8million,
in fi scal 2011 over fi scal 2010.
Gross profi t dollars increased in fi scal 2011 as compared to fi scal 2010 primarily due to increased sales, partially offset by the negative comparison of the
additional week included in fi scal 2010. Gross margin was 18.80% in fi scal 2011, a decline of 50 basis points from the gross margin of 19.30% in fi scal
2010. This decline in gross margin was primarily the result of the following factors described in the paragraphs below.
First, Sysco’s product cost infl ation was estimated as infl ation of 4.6% during fi scal 2011. Based on our product sales mix for fi scal 2011, we were most
impacted by higher levels of infl ation in the dairy, meat and seafood product categories in the range of 10% to 12%. Our largest selling product category,
canned and dry, experienced infl ation of 4%.