Sysco 2012 Annual Report Download - page 77
Download and view the complete annual report
Please find page 77 of the 2012 Sysco annual report below. You can navigate through the pages in the report by either clicking on the pages listed below, or by using the keyword search tool below to find specific information within the annual report.-
 1
1 -
2
-
3
-
4
-
5
-
6
-
7
-
8
-
9
-
10
-
11
-
12
-
13
-
14
-
15
-
16
-
17
-
18
-
19
-
20
-
21
-
22
-
23
-
24
-
25
-
26
-
27
-
28
-
29
-
30
-
31
-
32
-
33
-
34
-
35
-
36
-
37
-
38
-
39
-
40
-
41
-
42
-
43
-
44
-
45
-
46
-
47
-
48
-
49
-
50
-
51
-
52
-
53
-
54
-
55
-
56
-
57
-
58
-
59
-
60
-
61
-
62
-
63
-
64
-
65
-
66
-
 67
67 -
 68
68 -
 69
69 -
 70
70 -
 71
71 -
 72
72 -
 73
73 -
 74
74 -
 75
75 -
 76
76 -
 77
77 -
 78
78 -
 79
79 -
 80
80 -
 81
81 -
 82
82 -
 83
83 -
 84
84 -
 85
85 -
 86
86 -
 87
87 -
88
-
89
-
90
-
91
-
92
-
93
-
94
-
95
-
96
-
97
-
98
-
99
-
100
-
101
-
102
-
103
-
104
-
105
-
106
-
107
-
108
-
109
-
110
-
111
 |
 |

SYSCO CORPORATION-Form10-K54
PARTII
ITEM8Financial Statements and Supplementary Data
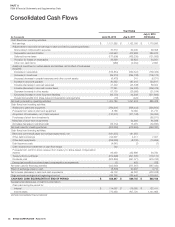
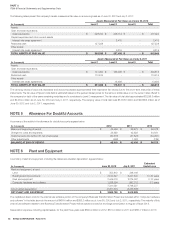
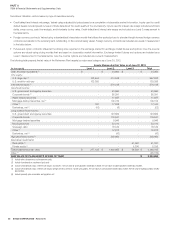
The following tables present the company’s assets measured at fair value on a recurring basis as of June30,2012 and July2,2011:
(In thousands)
Assets Measured at Fair Value as of June30,2012
Level1 Level2 Level3 Total
Assets:
Cash and cash equivalents
Cash equivalents $ 228,310 $ 248,714 $ - $ 477,024
Prepaid expenses and other current assets
Interest rate swap agreement - 2,475 - 2,475
Restricted cash 127,228 - - 127,228
Other assets
Interest rate swap agreement - 6,219 - 6,219
TOTAL ASSETS AT FAIR VALUE $ 355,538 $ 257,408 $ - $ 612,946
(In thousands)
Assets Measured at Fair Value as of July2,2011
Level1 Level2 Level3 Total
Assets:
Cash and cash equivalents
Cash equivalents $ 141,350 $ 163,465 $ - $ 304,815
Restricted cash 110,516 - - 110,516
Other assets
Interest rate swap agreements - 13,482 - 13,482
TOTAL ASSETS AT FAIR VALUE $ 251,866 $ 176,947 $ - $ 428,813
The carrying values of accounts receivable and accounts payable approximated their respective fair values due to the short-term maturities of these
instruments. The fair value of Sysco’s total debt is estimated based on the quoted market prices for the same or similar issue or on the current rates offered to
the company for debt of the same remaining maturities and is considered a Level2 measurement. The fair value of total debt approximated $3,539.3million
and $2,919.4million as of June30,2012 and July2,2011, respectively. The carrying value of total debt was $3,018.3million and $2,668.5million as of
June30,2012 and July2,2011, respectively.
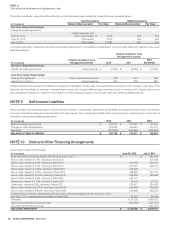
NOTE5 Allowance For Doubtful Accounts
A summary of the activity in the allowance for doubtful accounts appears below:
(In thousands)
2012 2011 2010
Balance at beginning of period $ 42,436 $ 36,573 $ 36,078
Charged to costs and expenses 33,359 42,623 34,931
Customer accounts written off, net of recoveries (32,318) (37,823) (34,297)
Other adjustments (558) 1,063 (139)
BALANCE AT END OF PERIOD $ 42,919 $ 42,436 $ 36,573
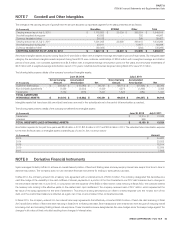
NOTE6 Plant and Equipment
A summary of plant and equipment, including the related accumulated depreciation, appears below:
(In thousands)
June30,2012 July2,2011
Estimated
Useful Lives
Plant and equipment, at cost:
Land $ 352,812 $ 348,168
Buildings and improvements 3,510,627 3,227,340 10-30 years
Fleet and equipment 2,449,018 2,275,007 3-10 years
Computer hardware and software 1,028,594 897,712 3-7 years
7,341,051 6,748,227
Accumulated depreciation (3,457,301) (3,235,838)
NET PLANT AND EQUIPMENT $ 3,883,750 $ 3,512,389
The capitalized direct costs for the internal use software portion of the company’s Business Transformation Project are included within “computer hardware
and software” in the table above in the amount of $469.4million and $356.2million as of June30,2012 and July2,2011, respectively. The majority of this
internal use software related to the Business Transformation Project will be placed into service and begin amortization in Augustof fi scal 2013.
Depreciation expense, including capital leases, for the past three years was $384.9million in 2012, $374.0million in 2011 and $361.7million in 2010.