Sysco 2012 Annual Report Download - page 101
Download and view the complete annual report
Please find page 101 of the 2012 Sysco annual report below. You can navigate through the pages in the report by either clicking on the pages listed below, or by using the keyword search tool below to find specific information within the annual report.-
 1
1 -
2
-
3
-
4
-
5
-
6
-
7
-
8
-
9
-
10
-
11
-
12
-
13
-
14
-
15
-
16
-
17
-
18
-
19
-
20
-
21
-
22
-
23
-
24
-
25
-
26
-
27
-
28
-
29
-
30
-
31
-
32
-
33
-
34
-
35
-
36
-
37
-
38
-
39
-
40
-
41
-
42
-
43
-
44
-
45
-
46
-
47
-
48
-
49
-
50
-
51
-
52
-
53
-
54
-
55
-
56
-
57
-
58
-
59
-
60
-
61
-
62
-
63
-
64
-
65
-
66
-
67
-
68
-
69
-
70
-
71
-
72
-
73
-
74
-
75
-
76
-
77
-
78
-
79
-
80
-
81
-
82
-
83
-
84
-
85
-
86
-
87
-
88
-
89
-
90
-
 91
91 -
 92
92 -
 93
93 -
 94
94 -
 95
95 -
 96
96 -
 97
97 -
 98
98 -
 99
99 -
 100
100 -
 101
101 -
 102
102 -
 103
103 -
 104
104 -
 105
105 -
 106
106 -
 107
107 -
 108
108 -
 109
109 -
 110
110 -
 111
111
 |
 |
SYSCO CORPORATION-Form10-K78
PARTII
ITEM8Financial Statements and Supplementary Data
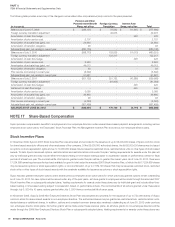
The sales mix for the principal product categories for each fi scal year is as follows:
(In thousands)
Fiscal Year
2012 2011
2010
(53Weeks)
Canned and dry products $ 7,948,187 $ 7,308,893 $ 7,152,628
Fresh and frozen meats 7,929,235 7,163,505 6,405,820
Frozen fruits, vegetables, bakery and other 5,757,871 5,337,625 5,220,307
Dairy products 4,456,634 4,145,350 3,709,410
Poultry 4,188,787 3,912,510 3,862,486
Fresh produce 3,332,504 3,345,929 3,179,947
Paper and disposables 3,295,483 3,055,862 2,906,426
Seafood 2,076,848 1,929,417 1,739,949
Beverage products 1,591,540 1,478,456 1,408,376
Janitorial products 952,569 902,636 907,189
Equipment and smallwares 613,590 581,628 599,267
Medical supplies 237,691 161,678 151,690
TOTAL $ 42,380,939 $ 39,323,489 $ 37,243,495
Information concerning geographic areas is as follows:
(In thousands)
Fiscal Year
2012 2011
2010
(53Weeks)
Sales:(1)
UnitedStates $ 37,596,862 $ 34,992,273 $ 33,268,481
Canada 4,246,611 3,864,420 3,550,605
Other 537,466 466,796 424,409
TOTAL $ 42,380,939 $ 39,323,489 $ 37,243,495
Long-lived assets:(2)
UnitedStates $ 3,564,854 $ 3,161,724 $ 2,884,728
Canada 291,304 321,185 291,514
Other 27,592 29,480 27,581
TOTAL $ 3,883,750 $ 3,512,389 $ 3,203,823
(1) Represents sales to external customers from businesses operating in these countries.
(2) Long-lived assets represents net property, plant and equipment reported in the country in which they are held.