Sysco 2012 Annual Report Download - page 71
Download and view the complete annual report
Please find page 71 of the 2012 Sysco annual report below. You can navigate through the pages in the report by either clicking on the pages listed below, or by using the keyword search tool below to find specific information within the annual report.-
 1
1 -
2
-
3
-
4
-
5
-
6
-
7
-
8
-
9
-
10
-
11
-
12
-
13
-
14
-
15
-
16
-
17
-
18
-
19
-
20
-
21
-
22
-
23
-
24
-
25
-
26
-
27
-
28
-
29
-
30
-
31
-
32
-
33
-
34
-
35
-
36
-
37
-
38
-
39
-
40
-
41
-
42
-
43
-
44
-
45
-
46
-
47
-
48
-
49
-
50
-
51
-
52
-
53
-
54
-
55
-
56
-
57
-
58
-
59
-
60
-
 61
61 -
 62
62 -
 63
63 -
 64
64 -
 65
65 -
 66
66 -
 67
67 -
 68
68 -
 69
69 -
 70
70 -
 71
71 -
 72
72 -
 73
73 -
 74
74 -
 75
75 -
 76
76 -
 77
77 -
 78
78 -
 79
79 -
 80
80 -
 81
81 -
82
-
83
-
84
-
85
-
86
-
87
-
88
-
89
-
90
-
91
-
92
-
93
-
94
-
95
-
96
-
97
-
98
-
99
-
100
-
101
-
102
-
103
-
104
-
105
-
106
-
107
-
108
-
109
-
110
-
111
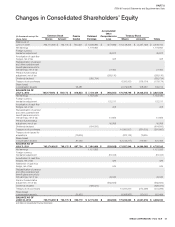
 |
 |

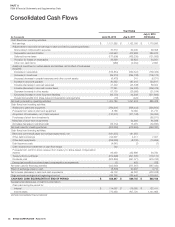
SYSCO CORPORATION-Form10-K48
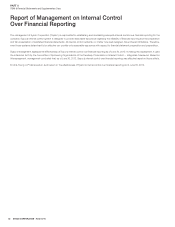
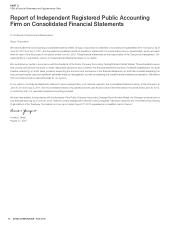
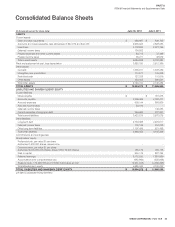
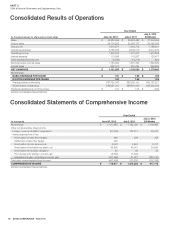
PARTII
ITEM8Financial Statements and Supplementary Data
Consolidated Cash Flows
(In thousands)
Year Ended
June30,2012 July2,2011
July3,2010
(53Weeks)
Cash fl ows from operating activities:
Net earnings $ 1,121,585 $ 1,152,030 $ 1,179,983
Adjustments to reconcile net earnings to cash provided by operating activities:
Share-based compensation expense 70,319 59,235 66,358
Depreciation and amortization 416,943 402,588 389,976
Deferred income taxes (177,906) (165,239) (121,865)
Provision for losses on receivables 33,359 42,623 34,931
Other non-cash items (958) (9,454) 2,550
Additional investment in certain assets and liabilities, net of effect of businesses
acquired:
(Increase) in receivables (106,834) (252,641) (166,426)
(Increase) in inventories (99,218) (254,738) (106,172)
(Increase) decrease in prepaid expenses and other current assets (6,478) 341 (6,271)
Increase in accounts payable 30,335 187,410 154,811
Increase (decrease) in accrued expenses 41,429 (43,348) 58,002
Increase (decrease) in accrued income taxes 71,251 (44,202) (296,475)
Decrease (increase) in other assets 57,138 (26,966) (31,514)
(Decrease) increase in other long-term liabilities (46,770) 44,308 (271,692)
Excess tax benefi ts from share-based compensation arrangements (15) (429) (768)
Net cash provided by operating activities 1,404,180 1,091,518 885,428
Cash fl ows from investing activities:
Additions to plant and equipment (784,501) (636,442) (594,604)
Proceeds from sales of plant and equipment 8,185 19,069 21,710
Acquisition of businesses, net of cash acquired (110,601) (101,148) (29,293)
Purchases of short-term investments - - (85,071)
Maturities of short-term investments - 24,993 61,568
(Increase) decrease in restricted cash (16,712) 13,972 (30,630)
Net cash used for investing activities (903,629) (679,556) (656,320)
Cash fl ows from fi nancing activities:
Bank and commercial paper borrowings (repayments), net (181,975) 181,975 -
Other debt borrowings 744,597 4,411 7,091
Other debt repayments (205,638) (8,732) (10,695)
Debt issuance costs (4,641) (7) (7)
Cash received from settlement of cash fl ow hedge 722 - -
Proceeds from common stock reissued from treasury for share-based compensation
awards 99,439 332,688 94,750
Treasury stock purchases (272,299) (291,600) (179,174)
Dividends paid (622,869) (597,071) (579,763)
Excess tax benefi ts from share-based compensation arrangements 15 429 768
Net cash used for fi nancing activities (442,649) (377,907) (667,030)
Effect of exchange rates on cash (8,800) 20,267 4,714
Net increase (decrease) in cash and cash equivalents 49,102 54,322 (433,208)
Cash and cash equivalents at beginning of period 639,765 585,443 1,018,651
CASH AND CASH EQUIVALENTS AT END OF PERIOD $ 688,867 $ 639,765 $ 585,443
Supplemental disclosures of cash fl ow information:
Cash paid during the period for:
Interest $ 114,067 $ 119,050 $ 127,411
Income taxes 772,493 907,720 1,141,963
See Notes to Consolidated Financial Statements