Sysco 2012 Annual Report Download - page 44
Download and view the complete annual report
Please find page 44 of the 2012 Sysco annual report below. You can navigate through the pages in the report by either clicking on the pages listed below, or by using the keyword search tool below to find specific information within the annual report.-
 1
1 -
2
-
3
-
4
-
5
-
6
-
7
-
8
-
9
-
10
-
11
-
12
-
13
-
14
-
15
-
16
-
17
-
18
-
19
-
20
-
21
-
22
-
23
-
24
-
25
-
26
-
27
-
28
-
29
-
30
-
31
-
32
-
33
-
 34
34 -
 35
35 -
 36
36 -
 37
37 -
 38
38 -
 39
39 -
 40
40 -
 41
41 -
 42
42 -
 43
43 -
 44
44 -
 45
45 -
 46
46 -
 47
47 -
 48
48 -
 49
49 -
 50
50 -
 51
51 -
 52
52 -
 53
53 -
 54
54 -
55
-
56
-
57
-
58
-
59
-
60
-
61
-
62
-
63
-
64
-
65
-
66
-
67
-
68
-
69
-
70
-
71
-
72
-
73
-
74
-
75
-
76
-
77
-
78
-
79
-
80
-
81
-
82
-
83
-
84
-
85
-
86
-
87
-
88
-
89
-
90
-
91
-
92
-
93
-
94
-
95
-
96
-
97
-
98
-
99
-
100
-
101
-
102
-
103
-
104
-
105
-
106
-
107
-
108
-
109
-
110
-
111
 |
 |
SYSCO CORPORATION-Form10-K 21
PARTII
ITEM7Management’s Discussion and Analysis of Financial Condition and Results of Operations
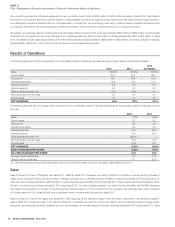
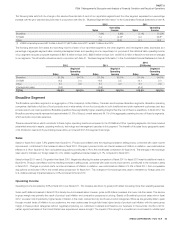
Second, ongoing strategic pricing initiatives in fi scal 2011 lowered our prices to our customers in certain product categories in order to increase sales volumes.
These initiatives are being phased in over time and resulted in short-term gross profi t declines as a percentage of sales, but we believe will result in long-term
gross profi t dollar growth due to higher sales volumes and increased market share. We have experienced meaningful year over year volume growth with those
items included in the early phases of these programs in the geographies where this program has been implemented. We believe the long-term benefi ts of
these strategic initiatives will result in profi table market share growth.
Third, gross profi t dollars for fi scal 2011 increased as a result of higher fuel surcharges. Fuel surcharges were approximately $26.0million higher in fi scal 2011
than in the comparable prior year period due to higher fuel prices incurred during fi scal 2011 and the application of fuel surcharges to a broader customer
base for a small portion of the third quarter and the entire fourth quarter.
Operating expenses for fi scal 2011 increased 4.8% primarily due to higher pay-related expense, an increase in net company-sponsored pension costs,
provisions for withdrawal from multiemployer pension plans and higher fuel costs as compared to the prior year period. The impact of these operating expense
increases was partially offset by a decrease in operating expenses of approximately $101.4million resulting from the absence of the 53
rd
week in fi scal 2010.
Adjusted operating expense increased 5.9%, or $298.8million, in fi scal 2011 over fi scal 2010.
Pay-related expenses, excluding labor costs associated with our Business Transformation Project, increased by $61.1million in fi scal 2011 over fi scal 2010.
The increase was primarily due to increased sales and delivery compensation. Pay-related expenses from acquired companies and changes in the exchange
rates used to translate our foreign sales into U.S. dollars also contributed to the increase. Partially offsetting these increases were lower provisions for current
management incentive bonuses of $13.9million.
Net company-sponsored pension costs in fi scal 2011 were $60.3million higher than in fi scal 2010. The increase in fi scal 2011 was due primarily to a decrease
in discount rates used to calculate our projected benefi t obligation and related pension expense at the end of fi scal 2010, partially offset by reduced amortization
of our net actuarial loss resulting from actuarial gains from higher returns on assets of Sysco’s Retirement Plan during fi scal 2010.
From time to time, we may voluntarily withdraw from multiemployer pension plans to minimize or limit our future exposure to these plans. In fi scal years 2011
and 2010, we voluntary withdrew from several multiemployer plans and recorded provisions of $41.5million in fi scal 2011 and $2.9million in fi scal 2010.
Fuel costs increased by $33.0million in fi scal 2011 over fi scal 2010 primarily due to increased contracted and market diesel prices. Our costs per gallon
increased 14.3% in fi scal 2011 over fi scal 2010. Our forward fuel commitments will result in either additional fuel costs or avoided fuel costs based on the
comparison of the prices on the fi xed price contracts and market prices for the respective periods. In fi scal 2011, the forward purchase commitments resulted
in an estimated $16.4million of avoided fuel costs as the fi xed price contracts were generally lower than market prices for the contracted volumes. In fi scal
2010, the forward purchase commitments resulted in an estimated $1.5million of additional fuel costs as the fi xed price contracts were higher than market
prices for the contracted volumes for a portion of the fi scal year.
For our Broadline companies, our cost per case increased $0.11 per case as compared to fi scal 2010. These increases primarily related to increased payroll
costs, increased fuel costs and charges created by withdrawing from multiemployer plans, all of which are discussed above.
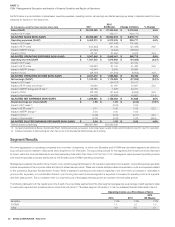
Net Earnings
Net earnings for fi scal 2012 decreased 2.6% over the comparable prior year period. This decrease was primarily due to changes in operating income discussed
above. Adjusted net earnings increased 4.7% during fi scal 2012.
Net earnings for fi scal 2011 decreased 2.4% over the comparable prior year period. This decrease was primarily due to the absence of the 53rd week in fi scal
2011, the factors discussed above and an increase in the effective tax rate. The effective tax rate for fi scal 2011 was 36.96%, compared to an effective tax
rate of 36.20% for fi scal 2010. The difference between the tax rates for the two periods resulted largely from the one-time reversal of interest accruals for
tax contingencies related to our settlement with the Internal Revenue Service (IRS) in the fi rst quarter of fi scal 2010. Adjusted net earnings increased 3.6%
during fi scal 2011.
The effective tax rate for fi scal 2012 was 37.13%. Indefi nitely reinvested earnings taxed at foreign statutory tax rates less than our domestic tax rate had the
impact of reducing the effective tax rate.
The effective tax rate of 36.96% for fi scal 2011 was favorably impacted primarily by two items. First, we recorded a tax benefi t of approximately $17.0million
for the reversal of valuation allowances previously recorded on state net operating loss carryforwards. Second, we adjust the carrying values of our COLI
policies to their cash surrender values. The gain of $28.2million recorded in fi scal 2011 was primarily non-taxable for income tax purposes, and had the
impact of decreasing income tax expense for the period by $11.1million. Partially offsetting these favorable impacts was the recording of $9.3million in tax
and interest related to various federal, foreign and state uncertain tax positions.