Sysco 2012 Annual Report Download - page 3
Download and view the complete annual report
Please find page 3 of the 2012 Sysco annual report below. You can navigate through the pages in the report by either clicking on the pages listed below, or by using the keyword search tool below to find specific information within the annual report.-
 1
1 -
 2
2 -
 3
3 -
 4
4 -
 5
5 -
 6
6 -
 7
7 -
 8
8 -
 9
9 -
 10
10 -
 11
11 -
 12
12 -
 13
13 -
 14
14 -
15
-
16
-
17
-
18
-
19
-
20
-
21
-
22
-
23
-
24
-
25
-
26
-
27
-
28
-
29
-
30
-
31
-
32
-
33
-
34
-
35
-
36
-
37
-
38
-
39
-
40
-
41
-
42
-
43
-
44
-
45
-
46
-
47
-
48
-
49
-
50
-
51
-
52
-
53
-
54
-
55
-
56
-
57
-
58
-
59
-
60
-
61
-
62
-
63
-
64
-
65
-
66
-
67
-
68
-
69
-
70
-
71
-
72
-
73
-
74
-
75
-
76
-
77
-
78
-
79
-
80
-
81
-
82
-
83
-
84
-
85
-
86
-
87
-
88
-
89
-
90
-
91
-
92
-
93
-
94
-
95
-
96
-
97
-
98
-
99
-
100
-
101
-
102
-
103
-
104
-
105
-
106
-
107
-
108
-
109
-
110
-
111
 |
 |

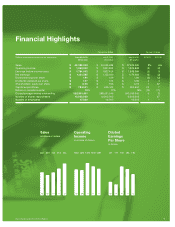
Financial Highlights
Fiscal Year Ended Percent Change
(Dollars in thousands, except for per share data) June 30, 2012 July 2, 2011 July 3, 2010 2012–11 2011–10
(52 weeks) (52 weeks) (53 weeks)
Sales $ 42,380,939 $ 39,323,489 $ 37,243,495 8% 6%
Operating income $ 1,890,632 $ 1,931,502 $ 1,975,868 (2) (2)
Earnings before income taxes $ 1,784,002 $ 1,827,454 $ 1,849,589 (2) (1)
Net earnings $ 1,121,585 $ 1,152,030 $ 1,179,983 (3) (2)
Diluted earnings per share $ 1.90 $ 1.96 $ 1.99 (3) (2)
Dividends declared per share $ 1.07 $ 1.03 $ 0.99 4 4
Shareholders’ equity per share $ 8.00 $ 7.95 $ 6.50 1 22
Capital expenditures $ 784,501 $ 636,442 $ 594,604 23 7
Return on invested capital 15% 17% 19% (12) (11)
Diluted average shares outstanding 588,991,441 588,691,546 593,590,042 0 (1)
Number of shares repurchased 10,000,000 10,000,000 6,000,000 – 67
Number of employees 47,800 46,000 46,000 4 –
Sales
in billions of dollars
Operating
Income
in millions of dollars
Diluted
Earnings
Per Share
in dollars
Sysco Corporation 2012 Annual Report 1
42.439.337.236.937.5 1, 8911,9321,9761,8721,8801.901.961.991.771.81
1211100908 12111009081211100908