Sysco 2012 Annual Report Download - page 48
Download and view the complete annual report
Please find page 48 of the 2012 Sysco annual report below. You can navigate through the pages in the report by either clicking on the pages listed below, or by using the keyword search tool below to find specific information within the annual report.-
 1
1 -
2
-
3
-
4
-
5
-
6
-
7
-
8
-
9
-
10
-
11
-
12
-
13
-
14
-
15
-
16
-
17
-
18
-
19
-
20
-
21
-
22
-
23
-
24
-
25
-
26
-
27
-
28
-
29
-
30
-
31
-
32
-
33
-
34
-
35
-
36
-
37
-
 38
38 -
 39
39 -
 40
40 -
 41
41 -
 42
42 -
 43
43 -
 44
44 -
 45
45 -
 46
46 -
 47
47 -
 48
48 -
 49
49 -
 50
50 -
 51
51 -
 52
52 -
 53
53 -
 54
54 -
 55
55 -
 56
56 -
 57
57 -
 58
58 -
59
-
60
-
61
-
62
-
63
-
64
-
65
-
66
-
67
-
68
-
69
-
70
-
71
-
72
-
73
-
74
-
75
-
76
-
77
-
78
-
79
-
80
-
81
-
82
-
83
-
84
-
85
-
86
-
87
-
88
-
89
-
90
-
91
-
92
-
93
-
94
-
95
-
96
-
97
-
98
-
99
-
100
-
101
-
102
-
103
-
104
-
105
-
106
-
107
-
108
-
109
-
110
-
111
 |
 |

SYSCO CORPORATION-Form10-K 25
PARTII
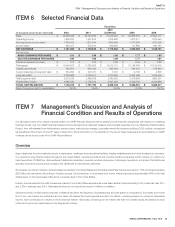
ITEM7Management’s Discussion and Analysis of Financial Condition and Results of Operations
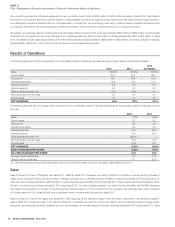
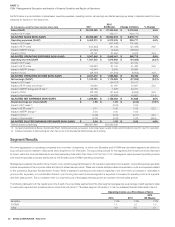
The following table sets forth the change in the selected fi nancial data of each of our reportable segments and the other segment expressed as a percentage
increase over the prior year and should be read in conjunction with Note21, “Business Segment Information” to the Consolidated Financial Statements in Item8:
2012 2011
Sales
Operating
Income Sales
Operating
Income
Broadline 7.8% 3.8% 5.1% (1.0)%
SYGMA 7.4 (2.0)(1) 9.2 26.8(1)
Other 7.0 (9.2) 5.1 14.3
(1) SYGMA had operating income of $61.0million in fiscal 2012, $62.2million in fiscal 2011 and $49.1million in fiscal 2010.
The following table sets forth sales and operating income of each of our reportable segments, the other segment, and intersegment sales, expressed as a
percentage of aggregate segment sales, including intersegment sales, and operating income, respectively. For purposes of this statistical table, operating income
of our segments excludes corporate expenses of $677.6million in fi scal 2012, $558.8million in fi scal 2011 and $513.3million in fi scal 2010 that are not charged
to our segments. This information should be read in conjunction with Note21, “Business Segment Information” to the Consolidated Financial Statements in Item8:
2012 2011
2010
(53Weeks)
Sales
Segment
Operating
Income Sales
Segment
Operating
Income Sales
Segment
Operating
Income
Broadline 81.2% 94.1% 81.2% 93.5% 81.6% 94.5%
SYGMA 13.5 2.4 13.6 2.5 13.1 2.0
Other 5.7 3.5 5.7 4.0 5.7 3.5
Intersegment sales (0.4) - (0.5) - (0.4) -
TOTAL 100.0% 100.0% 100.0% 100.0% 100.0% 100.0%
Broadline Segment
The Broadline reportable segment is an aggregation of the company’s UnitedStates, Canadian and European Broadline segments. Broadline operating
companies distribute a full line of food products and a wide variety of non-food products to both traditional and chain restaurant customers and also
provide custom-cut meat operations. Broadline operations have signifi cantly higher operating margins than the rest of Sysco’s operations. In fi scal 2012, the
Broadline operating results represented approximately 81.2% of Sysco’s overall sales and 94.1% of the aggregate operating income of Sysco’s segments,
which excludes corporate expenses.
There are several factors which contribute to these higher operating results as compared to the SYGMA and Other operating segments. We have invested
substantial amounts in assets, operating methods, technology and management expertise in this segment. The breadth of its sales force, geographic reach
of its distribution area and its purchasing power allow us to benefi t from this segment’s earnings.
Sales
Sales for fi scal 2012 were 7.8% greater than fi scal 2011. Product cost infl ation and the resulting increase in selling prices, combined with case volume
improvement, contributed to the increase in sales in fi scal 2012. Changes in product costs, an internal measure of infl ation or defl ation, were estimated as
infl ation of 5.7% in fi scal 2012. Non-comparable acquisitions contributed 0.7% to the overall sales comparison for fi scal 2012. The changes in the exchange
rates used to translate our foreign sales into U.S. dollars negatively impacted sales by 0.1% compared to fi scal 2011.
Sales for fi scal 2011 were 5.1% greater than fi scal 2010. Negatively affecting the sales comparison of fi scal 2011 to fi scal 2010 was the additional week in
fi scal 2010. Product cost infl ation and the resulting increase in selling prices, combined with case volume improvement, contributed to the increase in sales
in fi scal 2011. Changes in product costs, an internal measure of infl ation or defl ation, were estimated as infl ation of 4.9% in fi scal 2011. Non-comparable
acquisitions contributed 0.8% to the overall sales comparison for fi scal 2011. The changes in the exchange rates used to translate our foreign sales into
U.S. dollars positively impacted sales by 0.6% compared to fi scal 2010.
Operating Income
Operating income increased by 3.8% in fi scal 2012 over fi scal 2011. This increase was driven by gross profi t dollars increasing more than operating expenses.
Gross profi t dollars increased in fi scal 2012 primarily due to increased sales; however, gross profi t dollars increased at a lower rate than sales. This decline
in gross margin was primarily the result of product cost infl ation and competitive pressures on pricing. Based on Broadline’s product sales mix for fi scal
2012, we were most impacted by higher levels of infl ation in the meat, canned and dry and frozen product categories. While we are generally able to pass
through modest levels of infl ation to our customers, we were unable pass through fully these higher levels of product cost infl ation with the same gross
margin in these product categories without negatively impacting our customers’ business and therefore our business. In the summer months of 2012,
certain agricultural areas of the UnitedStates have experienced severe drought. The impact of this drought is uncertain and could result in volatile input