Sysco 2012 Annual Report Download - page 38
Download and view the complete annual report
Please find page 38 of the 2012 Sysco annual report below. You can navigate through the pages in the report by either clicking on the pages listed below, or by using the keyword search tool below to find specific information within the annual report.-
 1
1 -
2
-
3
-
4
-
5
-
6
-
7
-
8
-
9
-
10
-
11
-
12
-
13
-
14
-
15
-
16
-
17
-
18
-
19
-
20
-
21
-
22
-
23
-
24
-
25
-
26
-
27
-
 28
28 -
 29
29 -
 30
30 -
 31
31 -
 32
32 -
 33
33 -
 34
34 -
 35
35 -
 36
36 -
 37
37 -
 38
38 -
 39
39 -
 40
40 -
 41
41 -
 42
42 -
 43
43 -
 44
44 -
 45
45 -
 46
46 -
 47
47 -
 48
48 -
49
-
50
-
51
-
52
-
53
-
54
-
55
-
56
-
57
-
58
-
59
-
60
-
61
-
62
-
63
-
64
-
65
-
66
-
67
-
68
-
69
-
70
-
71
-
72
-
73
-
74
-
75
-
76
-
77
-
78
-
79
-
80
-
81
-
82
-
83
-
84
-
85
-
86
-
87
-
88
-
89
-
90
-
91
-
92
-
93
-
94
-
95
-
96
-
97
-
98
-
99
-
100
-
101
-
102
-
103
-
104
-
105
-
106
-
107
-
108
-
109
-
110
-
111
 |
 |

SYSCO CORPORATION-Form10-K 15
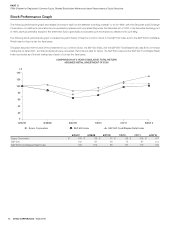
PARTII
ITEM7Management’s Discussion and Analysis of Financial Condition and Results of Operations
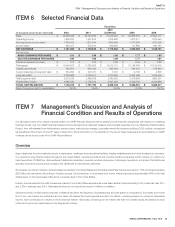
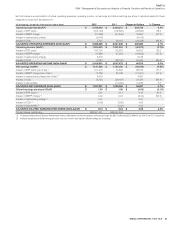
ITEM6 Selected Financial Data
(In thousands except for per share data)
Fiscal Year
2012 2011
2010
(53Weeks) 2009 2008
Sales $ 42,380,939 $ 39,323,489 $ 37,243,495 $ 36,853,330 $ 37,522,111
Operating income 1,890,632 1,931,502 1,975,868 1,872,211 1,879,949
Earnings before income taxes 1,784,002 1,827,454 1,849,589 1,770,834 1,791,338
Income taxes 662,417 675,424 669,606 714,886 685,187
NET EARNINGS $ 1,121,585 $ 1,152,030 $ 1,179,983 $ 1,055,948 $ 1,106,151
Net earnings:
BASIC EARNINGS PER SHARE $ 1.91 $ 1.96 $ 1.99 $ 1.77 $ 1.83
DILUTED EARNINGS PER SHARE 1.90 1.96 1.99 1.77 1.81
Dividends declared per share $ 1.07 $ 1.03 $ 0.99 $ 0.94 $ 0.85
Total assets $ 12,094,972 $ 11,385,555 $ 10,313,701 $ 10,148,486 $ 10,010,615
Capital expenditures 784,501 636,442 594,604 464,561 515,963
Current maturities of long-term debt $ 254,650 $ 207,031 $ 7,970 $ 9,163 $ 4,896
Long-term debt 2,763,688 2,279,517 2,472,662 2,467,486 1,975,435
Total long-term debt 3,018,338 2,486,548 2,480,632 2,476,649 1,980,331
Shareholders’ equity 4,685,040 4,705,242 3,827,526 3,449,702 3,408,986
TOTAL CAPITALIZATION $ 7,703,378 $ 7,191,790 $ 6,308,158 $ 5,926,351 $ 5,389,317
Ratio of long-term debt to capitalization 39.2% 34.6% 39.3% 41.8% 36.7%
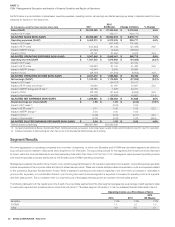
ITEM7 Management’s Discussion and Analysis of
Financial Condition and Results of Operations
Our discussion below of our results includes certain non-GAAP fi nancial measures that we believe provide important perspective with respect to underlying
business trends. Any non-GAAP fi nancial measure will be denoted as an adjusted measure and excludes expenses from our Business Transformation
Project, from withdrawals from multiemployer pension plans, restructuring charges, corporate-owned life insurance policies (COLI) policies, recognized
tax benefi ts and the impact of the 53rd week in fi scal 2010. More information on the rationale for the use of these measures and reconciliations to GAAP
numbers can be found under “Non-GAAP Reconciliations.”
Overview
Sysco distributes food and related products to restaurants, healthcare and educational facilities, lodging establishments and other foodservice customers.
Our operations are primarily located throughout the UnitedStates, Canada and Ireland and include broadline companies (which include our custom-cut
meat operations), SYGMA (our chain restaurant distribution subsidiary), specialty produce companies, hotel supply operations, a company that distributes
specialty imported products and a company that distributes to international customers.
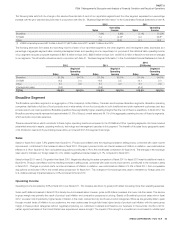
We consider our primary market to be the foodservice market in the UnitedStates and Canada and estimate that we serve about 17.5% of this approximately
$225billion annual market. According to industry sources, the foodservice, or food-away-from-home, market represents approximately 46% of the total
dollars spent on food purchases made at the consumer level in the UnitedStates.
Industry sources estimate the total foodservice market in the UnitedStates experienced a real sales decline of approximately 0.4% in calendar year 2011
and 2.5% in calendar year 2010. Real sales declines do not include the impact of infl ation or defl ation.
General economic conditions and consumer confi dence can affect the frequency of purchases and amounts spent by consumers for food-away-from-home
and, in turn, can impact our customers and our sales. We believe the current general economic conditions, including pressure on consumer disposable
income, have contributed to a decline in the foodservice market. Historically, we have grown at a faster rate than the overall industry and believe we have
continued to grow our market share in this fragmented industry.