Sysco 2012 Annual Report Download - page 52
Download and view the complete annual report
Please find page 52 of the 2012 Sysco annual report below. You can navigate through the pages in the report by either clicking on the pages listed below, or by using the keyword search tool below to find specific information within the annual report.-
 1
1 -
2
-
3
-
4
-
5
-
6
-
7
-
8
-
9
-
10
-
11
-
12
-
13
-
14
-
15
-
16
-
17
-
18
-
19
-
20
-
21
-
22
-
23
-
24
-
25
-
26
-
27
-
28
-
29
-
30
-
31
-
32
-
33
-
34
-
35
-
36
-
37
-
38
-
39
-
40
-
41
-
 42
42 -
 43
43 -
 44
44 -
 45
45 -
 46
46 -
 47
47 -
 48
48 -
 49
49 -
 50
50 -
 51
51 -
 52
52 -
 53
53 -
 54
54 -
 55
55 -
 56
56 -
 57
57 -
 58
58 -
 59
59 -
 60
60 -
 61
61 -
 62
62 -
63
-
64
-
65
-
66
-
67
-
68
-
69
-
70
-
71
-
72
-
73
-
74
-
75
-
76
-
77
-
78
-
79
-
80
-
81
-
82
-
83
-
84
-
85
-
86
-
87
-
88
-
89
-
90
-
91
-
92
-
93
-
94
-
95
-
96
-
97
-
98
-
99
-
100
-
101
-
102
-
103
-
104
-
105
-
106
-
107
-
108
-
109
-
110
-
111
 |
 |
SYSCO CORPORATION-Form10-K 29
PARTII
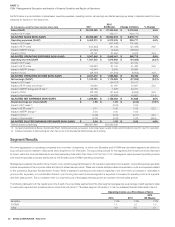
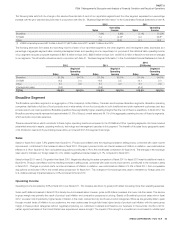
ITEM7Management’s Discussion and Analysis of Financial Condition and Results of Operations
Cash Flows
Operating Activities
Fiscal 2012 vs. Fiscal 2011
We generated $1.4billion in cash fl ow from operations in fi scal 2012, as compared to $1.1billion in fi scal 2011. The increase of $312.7million between
fi scal 2012 and fi scal 2011 was largely attributable to changes in working capital, a year-over-year reduction in tax payments and the redemption of some
of our COLI policies. These increases were partially offset by the year-over-year impact of multiemployer withdrawal provisions and payments. These items
are more fully described below.
Changes in working capital, specifi cally accounts receivable, inventory and accounts payable, contributed $144.3million to the increase in cash fl ow from
operations in fi scal 2012 as compared to fi scal 2011. Both periods were affected by increases in accounts receivable and inventory, partially offset by an
increase in accounts payable resulting primarily from infl ation-driven increases in product cost and sales. However, fi scal 2012 was impacted by these
items to a lesser extent due primarily to working capital improvements within accounts receivable and inventory and also less growth in average daily sales
in the fi nal month of fi scal 2012 as compared to the same period in fi scal 2011.
Tax payments were $135.2million less in fi scal 2012 than in fi scal 2011. The decrease in tax payments was partially due to the company being in a prepaid
position at the end of fi scal 2011 in certain jurisdictions. In addition, various movements in taxable temporary differences caused estimated taxable income
to be lower in fi scal 2012, requiring less tax payments in fi scal 2012 than in fi scal 2011. We made our fi nal payments on a previous IRS tax settlement of
$212million in fi scal 2012. The completion of these settlement payments will have a positive impact on our cash fl ows in fi scal 2013.
We received approximately $75million in cash from the one-time redemption during the period of some of our investments in COLI policies that we
maintained to meet a portion of our obligations under the Supplemental Executive Retirement Plan (SERP). This resulted in a positive impact to cash fl ow
from operations in fi scal 2012 by decreasing other assets by $57.1million. Those redeemed COLI policies were replaced by less volatile existing corporate-
owned real estate assets as part of our plan to reduce the market-driven COLI impact on our earnings.
Multiemployer withdrawal provisions and payments had a negative impact of $53.3million on the comparison of cash fl ow from operations in fi scal 2012
to fi scal 2011. The net impact of withdrawal provisions and payments was a cash outfl ow of $11.7million in fi scal 2012, compared to a $41.5million
accrual in fi scal 2011.
Fiscal 2011 vs. Fiscal 2010
We generated $1.1billion in cash fl ow from operations in fi scal 2011, as compared to $0.9billion in fi scal 2010. The increase of $206.1million between
fi scal 2011 and fi scal 2010 was driven largely by a reduction in the amount of payments made in relation to the IRS settlement of $316.0million and
reduced pension contributions in the amount of $136.3million in fi scal 2011 as compared to fi scal 2010. These increases were partially offset by changes
in working capital discussed in more detail below.
Payments related to the IRS settlement were $212.0million in fi scal 2011 and $528.0million in fi scal 2010. See further discussion of the IRS settlement
in Note18, “Income Taxes” to the Consolidated Financial Statements in Item8.
Our contributions to our company-sponsored defi ned benefi t plans were $161.7million in fi scal 2011 and $297.9million in fi scal 2010, respectively. Included
in the $161.7million of contributions in fi scal 2011 was a $140.0million contribution to our Retirement Plan that would normally have been made in fi scal
2012. Included in the $297.9million of contributions in fi scal 2010 was a $140.0million contribution to our Retirement Plan that would normally have been
made in fi scal 2011 and quarterly contributions totaling $140.0million for fi scal 2010.
Changes in working capital, specifi cally accounts receivable, inventory and accounts payable, reduced cash fl ow from operations by $202.2million in fi scal
2011 as compared to fi scal 2010. The increases in accounts receivable and inventory balances in fi scal 2011 and fi scal 2010 were primarily due to sales
growth. An increase in daily sales outstanding also contributed to the increase in accounts receivable and inventory balances in fi scal 2011. The increase
in accounts payable balances in fi scal 2011 and fi scal 2010 was primarily from the growth in inventory resulting from sales growth.
Investing Activities
Fiscal 2012 capital expenditures included:
•
replacement or signifi cant expansion of facilities in San Diego, California; Boston, Massachusetts; Lincoln, Nebraska; Syracuse, NewYork and central Texas;
•construction of fold-out facilities in southern California and Long Island, NewYork;
•the continued remodeling of our shared services facility purchased in fi scal 2010;
•fl eet replacements; and
•investments in technology including our Business Transformation Project.