Sysco 2012 Annual Report Download - page 62
Download and view the complete annual report
Please find page 62 of the 2012 Sysco annual report below. You can navigate through the pages in the report by either clicking on the pages listed below, or by using the keyword search tool below to find specific information within the annual report.-
 1
1 -
2
-
3
-
4
-
5
-
6
-
7
-
8
-
9
-
10
-
11
-
12
-
13
-
14
-
15
-
16
-
17
-
18
-
19
-
20
-
21
-
22
-
23
-
24
-
25
-
26
-
27
-
28
-
29
-
30
-
31
-
32
-
33
-
34
-
35
-
36
-
37
-
38
-
39
-
40
-
41
-
42
-
43
-
44
-
45
-
46
-
47
-
48
-
49
-
50
-
51
-
 52
52 -
 53
53 -
 54
54 -
 55
55 -
 56
56 -
 57
57 -
 58
58 -
 59
59 -
 60
60 -
 61
61 -
 62
62 -
 63
63 -
 64
64 -
 65
65 -
 66
66 -
 67
67 -
 68
68 -
 69
69 -
 70
70 -
 71
71 -
 72
72 -
73
-
74
-
75
-
76
-
77
-
78
-
79
-
80
-
81
-
82
-
83
-
84
-
85
-
86
-
87
-
88
-
89
-
90
-
91
-
92
-
93
-
94
-
95
-
96
-
97
-
98
-
99
-
100
-
101
-
102
-
103
-
104
-
105
-
106
-
107
-
108
-
109
-
110
-
111
 |
 |
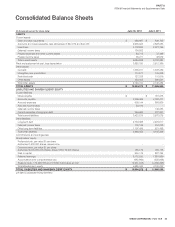
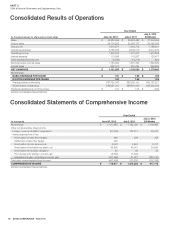
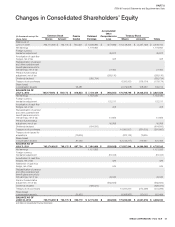
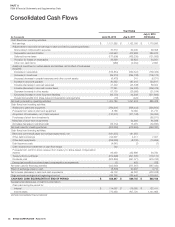
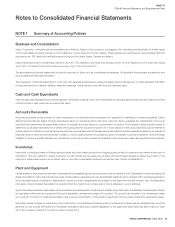
SYSCO CORPORATION-Form10-K 39
PARTII
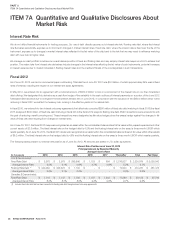
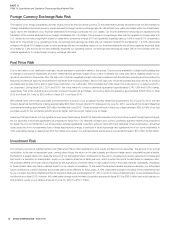
ITEM7AQuantitative and Qualitative Disclosures About Market Risk
(In thousands)
Interest Rate Position as of June30,2012
Notional Amount by Expected Maturity
Average Interest Swap Rate
2013 2014 2015 2016 2017 Thereafter Total Fair Value
Interest Rate Swaps
Related To Debt:
Pay Variable/Receive Fixed $ 250,000 $ 200,000 $ - $ - $ - $ - $ 450,000 $ 8,694
Average Variable Rate Paid:
Rate A Plus 2.1% 2.1% - - - - 2.1%
Fixed Rate Received 4.2% 4.6% - - - - 4.4%
Rate A– three-month LIBOR
Fiscal 2011
As of July2,2011, we had no commercial paper outstanding. Total debt as of July2,2011 was $2.7billion, of which approximately 75% was at fi xed
rates of interest, including the impact of our interest rate swap agreements.
As of July2,2011, the fi scal 2013 swap was recognized as an asset within the consolidated balance sheet at fair value within other assets of $6.1million.
The fi xed interest rate on the hedged debt is 4.2% and the fl oating interest rate on the swap is three-month LIBOR which resets quarterly. As of July2,2011,
the fi scal 2014 swap was recognized as an asset within the consolidated balance sheet at fair value within other assets of $7.4million. The fi xed interest
rate on the hedged debt is 4.6% and the fl oating interest rate on the swap is three-month LIBOR which resets quarterly.
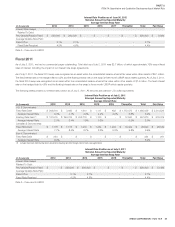
The following tables present our interest rate position as of July2,2011. All amounts are stated in U.S. dollar equivalents.
(In thousands)
Interest Rate Position as of July2,2011
Principal Amount by Expected Maturity
Average Interest Rate
2012 2013 2014 2015 2016 Thereafter Total Fair Value
U.S. $ Denominated:
Fixed Rate Debt $ 205,616 $ 3,682 $ 1,910 $ 1,117 $ 632 $ 1,772,072 $ 1,985,029 $ 2,214,529
Average Interest Rate 6.0% 4.1% 4.4% 4.4% 4.6% 5.8% 5.9%
Floating Rate Debt(1) $ 181,975 $ 253,316 $ 208,779 $ 1,100 $ - $ 12,500 $ 657,670 $ 676,075
Average Interest Rate 2.0% 2.4% 1.9% 0.2% - 0.5% 2.0%
Canadian $ Denominated:
Fixed Rate Debt $ 1,178 $ 1,173 $ 1,219 $ 1,264 $ 1,264 $ 19,492 $ 25,590 $ 28,549
Average Interest Rate 7.7% 8.4% 8.7% 8.8% 9.3% 9.8% 9.5%
Euro € Denominated:
Fixed Rate Debt $ 234 $ - $ - $ - $ - $ - $ 234 $ 261
Average Interest Rate 8.9% - - - - - 8.9%
(1) Includes fixed rate debt that has been converted to floating rate debt through interest rate swap agreements.
(In thousands)
Interest Rate Position as of July2,2011
Notional Amount by Expected Maturity
Average Interest Swap Rate
2012 2013 2014 2015 2016 Thereafter Total Fair Value
Interest Rate Swaps
Related To Debt:
Pay Variable/Receive Fixed $ - $ 250,000 $ 200,000 $ $ - $ - $ 450,000 $ 13,482
Average Variable Rate Paid:
Rate A Plus - 2.1% 2.1% - - 2.1%
Fixed Rate Received - 4.2% 4.6% - - 4.4%
Rate A– three-month LIBOR