Sysco 2012 Annual Report Download - page 17
Download and view the complete annual report
Please find page 17 of the 2012 Sysco annual report below. You can navigate through the pages in the report by either clicking on the pages listed below, or by using the keyword search tool below to find specific information within the annual report.-
 1
1 -
2
-
3
-
4
-
5
-
6
-
 7
7 -
 8
8 -
 9
9 -
 10
10 -
 11
11 -
 12
12 -
 13
13 -
 14
14 -
 15
15 -
 16
16 -
 17
17 -
 18
18 -
 19
19 -
 20
20 -
 21
21 -
 22
22 -
 23
23 -
 24
24 -
 25
25 -
 26
26 -
 27
27 -
28
-
29
-
30
-
31
-
32
-
33
-
34
-
35
-
36
-
37
-
38
-
39
-
40
-
41
-
42
-
43
-
44
-
45
-
46
-
47
-
48
-
49
-
50
-
51
-
52
-
53
-
54
-
55
-
56
-
57
-
58
-
59
-
60
-
61
-
62
-
63
-
64
-
65
-
66
-
67
-
68
-
69
-
70
-
71
-
72
-
73
-
74
-
75
-
76
-
77
-
78
-
79
-
80
-
81
-
82
-
83
-
84
-
85
-
86
-
87
-
88
-
89
-
90
-
91
-
92
-
93
-
94
-
95
-
96
-
97
-
98
-
99
-
100
-
101
-
102
-
103
-
104
-
105
-
106
-
107
-
108
-
109
-
110
-
111
 |
 |

Sysco Corporation 2012 Annual Report 15
Key Financial Metrics
Dividends
Declared
Per Share
in dollars
Net Earnings
in millions of dollars
NetCash
from Operations
in millions of dollars
1,4041,0928851,5771,570
1211100908
1,1221,1521,1801,0561,106
1211100908
1.071.030.990.940.85
1211100908
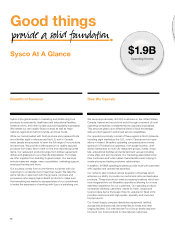
$42.4B
Sales $1.1B
Net Earnings
$1.07
Dividends
Declared
Per Share
$1.4B
Net Cash
from Operations
$1.90
Diluted Earnings
Per Share