Sysco 2012 Annual Report Download - page 88
Download and view the complete annual report
Please find page 88 of the 2012 Sysco annual report below. You can navigate through the pages in the report by either clicking on the pages listed below, or by using the keyword search tool below to find specific information within the annual report.-
 1
1 -
2
-
3
-
4
-
5
-
6
-
7
-
8
-
9
-
10
-
11
-
12
-
13
-
14
-
15
-
16
-
17
-
18
-
19
-
20
-
21
-
22
-
23
-
24
-
25
-
26
-
27
-
28
-
29
-
30
-
31
-
32
-
33
-
34
-
35
-
36
-
37
-
38
-
39
-
40
-
41
-
42
-
43
-
44
-
45
-
46
-
47
-
48
-
49
-
50
-
51
-
52
-
53
-
54
-
55
-
56
-
57
-
58
-
59
-
60
-
61
-
62
-
63
-
64
-
65
-
66
-
67
-
68
-
69
-
70
-
71
-
72
-
73
-
74
-
75
-
76
-
77
-
 78
78 -
 79
79 -
 80
80 -
 81
81 -
 82
82 -
 83
83 -
 84
84 -
 85
85 -
 86
86 -
 87
87 -
 88
88 -
 89
89 -
 90
90 -
 91
91 -
 92
92 -
 93
93 -
 94
94 -
 95
95 -
 96
96 -
 97
97 -
 98
98 -
99
-
100
-
101
-
102
-
103
-
104
-
105
-
106
-
107
-
108
-
109
-
110
-
111
 |
 |

SYSCO CORPORATION-Form10-K 65
PARTII
ITEM8Financial Statements and Supplementary Data
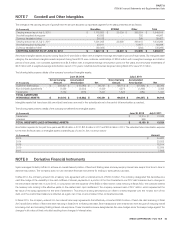
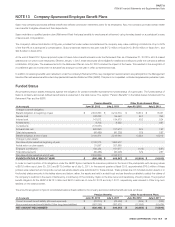
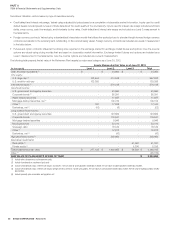
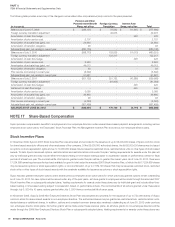
The following table presents the fair value of the Retirement Plan’s assets by major asset category as of July2,2011:
(In thousands)
Assets Measured at Fair Value as of July2,2011
Level1 Level2 Level3 Total
Cash and cash equivalents(1) $ - $ 112,217 $ - $ 112,217
U.S. equity:
U.S. large-cap(1) 139,048 357,712 - 496,760
U.S. small-to-mid-cap 166,890 - - 166,890
International equity(2) 117,655 455,811 - 573,466
Core fi xed income:
U.S. government and agency securities - 62,691 - 62,691
Corporate bonds(1) - 80,379 - 80,379
Asset-backed securities - 8,704 - 8,704
Mortgage-backed securities, net(3) - 129,941 - 129,941
Other(1) 204 17,296 - 17,500
Derivatives, net(4) (34) (340) - (374)
Long duration fi xed income:
U.S. government and agency securities - 79,970 - 79,970
Corporate bonds - 139,916 - 139,916
Mortgage-backed securities - 11,810 - 11,810
Municipal bonds - 18,786 - 18,786
Sovereign debt - 10,552 - 10,552
Other(1) - 12,529 - 12,529
Derivatives, net(5) 280 512 - 792
High yield fi xed income(2) - 191,583 - 191,583
Alternative investments:
Real estate(2) - - 30,615 30,615
Private equity(2) - - 1,480 1,480
Total investments at fair value $ 424,043 $ 1,690,069 $ 32,095 $ 2,146,207
Other(6) (39,894)
FAIR VALUE OF PLAN ASSETS AT END OF YEAR $ 2,106,313
(1) Include direct investments and investment funds.
(2) Include investments in investment funds only.
(3) Include direct investments, investment funds and forward settling sales.
(4) Include credit default swaps, interest rate swaps and futures. The fair value of asset positions totaled $8.6million; the fair value of liability positions totaled $9.0million.
(5) Include credit default swaps, interest rate swaps, foreign currency contracts, futures and options. The fair value of asset positions totaled $1.1million; the fair value of liability positions totaled
$0.3million.
(6) Include primarily plan receivables and payables, net.
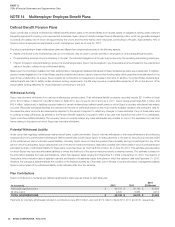
The following table sets forth a summary of changes in the fair value of the Retirement Plan’s Level3 assets for each fi scal year:
(In thousands)
Real Estate
Funds
Private Equity
Funds
Total Level3
Measurements
Balance, July3,2010 $ 17,065 $ - $ 17,065
Actual return on plan assets:
Relating to assets still held at the reporting date 3,371 72 3,443
Relating to assets sold during the period - - -
Purchases and sales, net 10,179 1,408 11,587
Transfers in and/or out of Level3 - - -
Balance, July2,2011 $ 30,615 $ 1,480 $ 32,095
Actual return on plan assets:
Relating to assets still held at the reporting date 2,155 (14) 2,141
Relating to assets sold during the period - - -
Purchases and sales, net 18,327 3,829 22,156
Transfers in and/or out of Level3 - - -
BALANCE, JUNE30,2012 $ 51,097 $ 5,295 $ 56,392