Sysco 2012 Annual Report Download - page 100
Download and view the complete annual report
Please find page 100 of the 2012 Sysco annual report below. You can navigate through the pages in the report by either clicking on the pages listed below, or by using the keyword search tool below to find specific information within the annual report.-
 1
1 -
2
-
3
-
4
-
5
-
6
-
7
-
8
-
9
-
10
-
11
-
12
-
13
-
14
-
15
-
16
-
17
-
18
-
19
-
20
-
21
-
22
-
23
-
24
-
25
-
26
-
27
-
28
-
29
-
30
-
31
-
32
-
33
-
34
-
35
-
36
-
37
-
38
-
39
-
40
-
41
-
42
-
43
-
44
-
45
-
46
-
47
-
48
-
49
-
50
-
51
-
52
-
53
-
54
-
55
-
56
-
57
-
58
-
59
-
60
-
61
-
62
-
63
-
64
-
65
-
66
-
67
-
68
-
69
-
70
-
71
-
72
-
73
-
74
-
75
-
76
-
77
-
78
-
79
-
80
-
81
-
82
-
83
-
84
-
85
-
86
-
87
-
88
-
89
-
 90
90 -
 91
91 -
 92
92 -
 93
93 -
 94
94 -
 95
95 -
 96
96 -
 97
97 -
 98
98 -
 99
99 -
 100
100 -
 101
101 -
 102
102 -
 103
103 -
 104
104 -
 105
105 -
 106
106 -
 107
107 -
 108
108 -
 109
109 -
 110
110 -
111
 |
 |

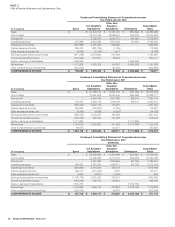
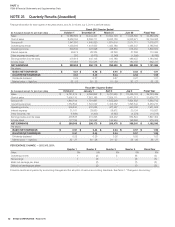
SYSCO CORPORATION-Form10-K 77
PARTII
ITEM8Financial Statements and Supplementary Data
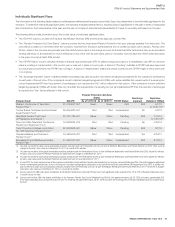
The following table sets forth the fi nancial information for Sysco’s business segments:
(In thousands)
Fiscal Year
2012 2011
2010
(53Weeks)
Sales:
Broadline $ 34,420,851 $ 31,924,473 $ 30,381,283
SYGMA 5,735,673 5,341,094 4,891,279
Other 2,396,113 2,238,796 2,129,862
Intersegment sales (171,698) (180,874) (158,929)
TOTAL $ 42,380,939 $ 39,323,489 $ 37,243,495
Operating income:
Broadline $ 2,416,225 $ 2,327,847 $ 2,352,493
SYGMA 60,967 62,190 49,057
Other 91,048 100,222 87,667
Total segments 2,568,240 2,490,259 2,489,217
Corporate expenses (677,608) (558,757) (513,349)
Total operating income 1,890,632 1,931,502 1,975,868
Interest expense 113,396 118,267 125,477
Other expense (income), net (6,766) (14,219) 802
EARNINGS BEFORE INCOME TAXES $ 1,784,002 $ 1,827,454 $ 1,849,589
Depreciation and amortization:
Broadline $ 298,852 $ 291,756 $ 283,167
SYGMA 27,706 24,975 23,822
Other 24,745 25,131 26,861
Total segments 351,303 341,862 333,850
Corporate 65,640 60,726 56,126
TOTAL $ 416,943 $ 402,588 $ 389,976
Capital expenditures:
Broadline $ 525,368 $ 353,296 $ 407,340
SYGMA 30,961 38,612 25,436
Other 41,669 20,228 11,743
Total segments 597,998 412,136 444,519
Corporate 186,503 224,306 150,085
TOTAL $ 784,501 $ 636,442 $ 594,604
Assets:
Broadline $ 8,025,677 $ 7,220,046 $ 6,402,181
SYGMA 475,877 456,204 392,883
Other 877,207 814,174 754,409
Total segments 9,378,761 8,490,424 7,549,473
Corporate 2,716,211 2,895,131 2,764,228
TOTAL $ 12,094,972 $ 11,385,555 $ 10,313,701