Humana 2011 Annual Report Download - page 112
Download and view the complete annual report
Please find page 112 of the 2011 Humana annual report below. You can navigate through the pages in the report by either clicking on the pages listed below, or by using the keyword search tool below to find specific information within the annual report.-
 1
1 -
2
-
3
-
4
-
5
-
6
-
7
-
8
-
9
-
10
-
11
-
12
-
13
-
14
-
15
-
16
-
17
-
18
-
19
-
20
-
21
-
22
-
23
-
24
-
25
-
26
-
27
-
28
-
29
-
30
-
31
-
32
-
33
-
34
-
35
-
36
-
37
-
38
-
39
-
40
-
41
-
42
-
43
-
44
-
45
-
46
-
47
-
48
-
49
-
50
-
51
-
52
-
53
-
54
-
55
-
56
-
57
-
58
-
59
-
60
-
61
-
62
-
63
-
64
-
65
-
66
-
67
-
68
-
69
-
70
-
71
-
72
-
73
-
74
-
75
-
76
-
77
-
78
-
79
-
80
-
81
-
82
-
83
-
84
-
85
-
86
-
87
-
88
-
89
-
90
-
91
-
92
-
93
-
94
-
95
-
96
-
97
-
98
-
99
-
100
-
101
-
 102
102 -
 103
103 -
 104
104 -
 105
105 -
 106
106 -
 107
107 -
 108
108 -
 109
109 -
 110
110 -
 111
111 -
 112
112 -
 113
113 -
 114
114 -
 115
115 -
 116
116 -
 117
117 -
 118
118 -
 119
119 -
 120
120 -
 121
121 -
 122
122 -
123
-
124
-
125
-
126
-
127
-
128
-
129
-
130
-
131
-
132
-
133
-
134
-
135
-
136
-
137
-
138
-
139
-
140
-
141
-
142
-
143
-
144
-
145
-
146
-
147
-
148
-
149
-
150
-
151
-
152
-
153
-
154
-
155
-
156
-
157
-
158
-
159
-
160
 |
 |

Humana Inc.
NOTES TO CONSOLIDATED FINANCIAL STATEMENTS—(Continued)
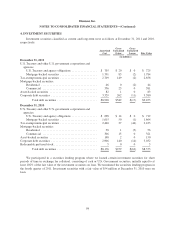
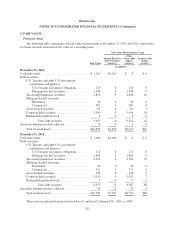
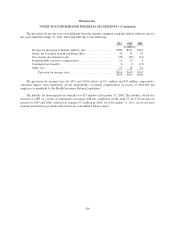
Our Level 3 assets had a fair value of $41 million at December 31, 2011, or less than 0.5% of our total
invested assets. During the years ended December 31, 2011, 2010, and 2009, the changes in the fair value of the
assets measured using significant unobservable inputs (Level 3) were comprised of the following:
For the years ended December 31,
2011 2010 2009
Auction
Rate
Securities
Private
Placements/
Venture
Capital Total
Auction
Rate
Securities
Private
Placements/
Venture
Capital Total
Auction
Rate
Securities
Private
Placements/
Venture
Capital Total
(in millions)
Beginning balance at January 1 . . . $ 52 $14 $ 66 $69 $24 $93 $74 $18 $92
Total gains or losses:
Realized in earnings .... 1 1 2 0 6 6 0 0 0
Unrealized in other
comprehensive
income ............ 1 0 1 2 (4) (2) 0 5 5
Purchases ................ 0 17 17 0 3 3 0 0 0
Sales .................... (38) (7) (45) (3) (13) (16) (1) 0 (1)
Settlements ............... 0 0 0 (16) (2) (18) (4) (2) (6)
Transfers into Level 3 ...... 0 0 0 0 0 0 0 3 3
Balance at December 31 ......... $16 $25 $41 $52 $14 $66 $69 $24 $93
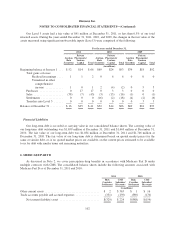
Financial Liabilities
Our long-term debt is recorded at carrying value in our consolidated balance sheets. The carrying value of
our long-term debt outstanding was $1,659 million at December 31, 2011 and $1,669 million at December 31,
2010. The fair value of our long-term debt was $1,834 million at December 31, 2011 and $1,746 million at
December 31, 2010. The fair value of our long-term debt is determined based on quoted market prices for the
same or similar debt, or, if no quoted market prices are available, on the current prices estimated to be available
to us for debt with similar terms and remaining maturities.
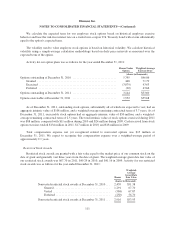
6. MEDICARE PART D
As discussed in Note 2, we cover prescription drug benefits in accordance with Medicare Part D under
multiple contracts with CMS. The consolidated balance sheets include the following amounts associated with
Medicare Part D as of December 31, 2011 and 2010:
2011 2010
Risk
Corridor
Settlement
CMS
Subsidies/
Discounts
Risk
Corridor
Settlement
CMS
Subsidies/
Discounts
(in millions)
Other current assets ..................................... $ 2 $363 $ 1 $ 16
Trade accounts payable and accrued expenses ................ (331) (139) (389) (170)
Net current (liability) asset ........................... $(329) $ 224 $(388) $(154)
102