Humana 2011 Annual Report Download - page 133
Download and view the complete annual report
Please find page 133 of the 2011 Humana annual report below. You can navigate through the pages in the report by either clicking on the pages listed below, or by using the keyword search tool below to find specific information within the annual report.-
 1
1 -
2
-
3
-
4
-
5
-
6
-
7
-
8
-
9
-
10
-
11
-
12
-
13
-
14
-
15
-
16
-
17
-
18
-
19
-
20
-
21
-
22
-
23
-
24
-
25
-
26
-
27
-
28
-
29
-
30
-
31
-
32
-
33
-
34
-
35
-
36
-
37
-
38
-
39
-
40
-
41
-
42
-
43
-
44
-
45
-
46
-
47
-
48
-
49
-
50
-
51
-
52
-
53
-
54
-
55
-
56
-
57
-
58
-
59
-
60
-
61
-
62
-
63
-
64
-
65
-
66
-
67
-
68
-
69
-
70
-
71
-
72
-
73
-
74
-
75
-
76
-
77
-
78
-
79
-
80
-
81
-
82
-
83
-
84
-
85
-
86
-
87
-
88
-
89
-
90
-
91
-
92
-
93
-
94
-
95
-
96
-
97
-
98
-
99
-
100
-
101
-
102
-
103
-
104
-
105
-
106
-
107
-
108
-
109
-
110
-
111
-
112
-
113
-
114
-
115
-
116
-
117
-
118
-
119
-
120
-
121
-
122
-
 123
123 -
 124
124 -
 125
125 -
 126
126 -
 127
127 -
 128
128 -
 129
129 -
 130
130 -
 131
131 -
 132
132 -
 133
133 -
 134
134 -
 135
135 -
 136
136 -
 137
137 -
 138
138 -
 139
139 -
 140
140 -
 141
141 -
 142
142 -
 143
143 -
144
-
145
-
146
-
147
-
148
-
149
-
150
-
151
-
152
-
153
-
154
-
155
-
156
-
157
-
158
-
159
-
160
 |
 |

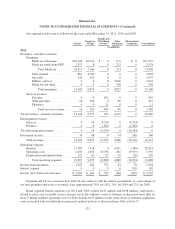
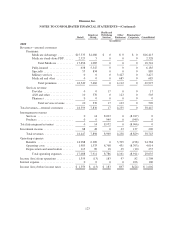
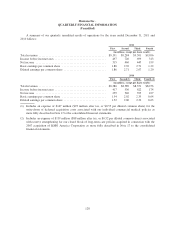
Humana Inc.
NOTES TO CONSOLIDATED FINANCIAL STATEMENTS—(Continued)
Retail
Employer
Group
Health and
Well-Being
Services
Other
Businesses
Eliminations/
Corporate Consolidated
(in millions)
2009
Revenues—external customers
Premiums:
Medicare Advantage .......... $15,333 $1,080 $ 0 $ 0 $ 0 $16,413
Medicare stand-alone PDP ...... 2,323 5 0 0 0 2,328
Total Medicare ........... 17,656 1,085 0 0 0 18,741
Fully-insured ................ 638 5,547 0 0 0 6,185
Specialty .................... 55 834 0 0 0 889
Military services ............. 0 0 0 3,427 0 3,427
Medicaid and other ........... 0 0 0 685 0 685
Total premiums .......... 18,349 7,466 0 4,112 0 29,927
Services revenue:
Provider .................... 0 0 17 0 0 17
ASO and other ............... 10 370 0 123 0 503
Pharmacy ................... 0 0 0 0 0 0
Total services revenue ..... 10 370 17 123 0 520
Total revenues—external customers ...... 18,359 7,836 17 4,235 0 30,447
Intersegment revenues
Services ........................ 0 14 8,003 0 (8,017) 0
Products ........................ 0 0 949 0 (949) 0
Total intersegment revenues ............ 0 14 8,952 0 (8,966) 0
Investment income .................... 88 48 0 23 137 296
Total revenues ................... 18,447 7,898 8,969 4,258 (8,829) 30,743
Operating expenses:
Benefits ........................ 14,988 6,289 0 3,705 (198) 24,784
Operating costs .................. 1,985 1,533 8,768 431 (8,703) 4,014
Depreciation and amortization ....... 115 89 18 25 (10) 237
Total operating expenses ....... 17,088 7,911 8,786 4,161 (8,911) 29,035
Income (loss) from operations ........... 1,359 (13) 183 97 82 1,708
Interest expense ...................... 0 0 0 0 106 106
Income (loss) before income taxes ....... $ 1,359 $ (13) $ 183 $97 $(24) $ 1,602
123