Humana 2011 Annual Report Download - page 81
Download and view the complete annual report
Please find page 81 of the 2011 Humana annual report below. You can navigate through the pages in the report by either clicking on the pages listed below, or by using the keyword search tool below to find specific information within the annual report.-
 1
1 -
2
-
3
-
4
-
5
-
6
-
7
-
8
-
9
-
10
-
11
-
12
-
13
-
14
-
15
-
16
-
17
-
18
-
19
-
20
-
21
-
22
-
23
-
24
-
25
-
26
-
27
-
28
-
29
-
30
-
31
-
32
-
33
-
34
-
35
-
36
-
37
-
38
-
39
-
40
-
41
-
42
-
43
-
44
-
45
-
46
-
47
-
48
-
49
-
50
-
51
-
52
-
53
-
54
-
55
-
56
-
57
-
58
-
59
-
60
-
61
-
62
-
63
-
64
-
65
-
66
-
67
-
68
-
69
-
70
-
 71
71 -
 72
72 -
 73
73 -
 74
74 -
 75
75 -
 76
76 -
 77
77 -
 78
78 -
 79
79 -
 80
80 -
 81
81 -
 82
82 -
 83
83 -
 84
84 -
 85
85 -
 86
86 -
 87
87 -
 88
88 -
 89
89 -
 90
90 -
 91
91 -
92
-
93
-
94
-
95
-
96
-
97
-
98
-
99
-
100
-
101
-
102
-
103
-
104
-
105
-
106
-
107
-
108
-
109
-
110
-
111
-
112
-
113
-
114
-
115
-
116
-
117
-
118
-
119
-
120
-
121
-
122
-
123
-
124
-
125
-
126
-
127
-
128
-
129
-
130
-
131
-
132
-
133
-
134
-
135
-
136
-
137
-
138
-
139
-
140
-
141
-
142
-
143
-
144
-
145
-
146
-
147
-
148
-
149
-
150
-
151
-
152
-
153
-
154
-
155
-
156
-
157
-
158
-
159
-
160
 |
 |

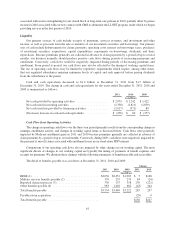
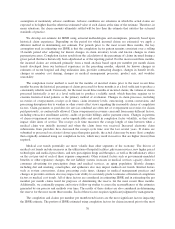
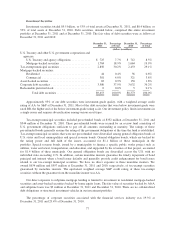
recent three months is generally less variable than the portion of IBNR estimated using trend factors. The
following table illustrates the sensitivity of these factors assuming moderate adverse experience and the
estimated potential impact on our operating results caused by reasonably likely changes in these factors based on
December 31, 2011 data:
Completion Factor (a): Claims Trend Factor (b):
Factor
Change (c)
Decrease in
Benefits Payable
Factor
Change (c)
Decrease in
Benefits Payable
(dollars in millions)
1.60% $(263) (4.75)% $(269)
1.20% $(198) (4.25)% $(241)
0.80% $(132) (3.50)% $(198)
0.40% $ (66) (3.00)% $(170)
0.30% $ (49) (2.50)% $(142)
0.20% $ (33) (2.00)% $(113)
0.10% $ (16) (1.50)% $ (85)
(a) Reflects estimated potential changes in benefits payable at December 31, 2011 caused by changes in
completion factors for incurred months prior to the most recent three months.
(b) Reflects estimated potential changes in benefits payable at December 31, 2011 caused by changes in
annualized claims trend used for the estimation of per member per month incurred claims for the most
recent three months.
(c) The factor change indicated represents the percentage point change.
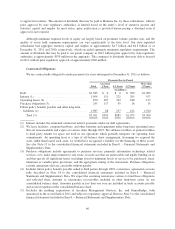
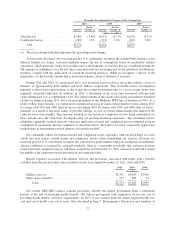
The following table provides a historical perspective regarding the accrual and payment of our benefits
payable, excluding military services. Components of the total incurred claims for each year include amounts
accrued for current year estimated benefit expenses as well as adjustments to prior year estimated accruals.
2011 2010 2009
(in millions)
Balances at January 1 .............................................. $ 3,214 $ 2,943 $ 2,898
Acquisitions ..................................................... 29 0 0
Incurred related to:
Current year ................................................. 25,821 24,186 21,944
Prior years .................................................. (372) (434) (253)
Total incurred ............................................ 25,449 23,752 21,691
Paid related to:
Current year ................................................. (22,729) (21,269) (19,211)
Prior years .................................................. (2,548) (2,212) (2,435)
Total paid ............................................... (25,277) (23,481) (21,646)
Balances at December 31 ........................................... $ 3,415 $ 3,214 $ 2,943
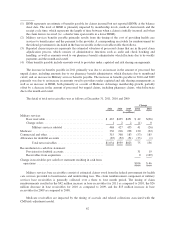
The following table summarizes the changes in estimate for incurred claims related to prior years
attributable to our key assumptions. As previously described, our key assumptions consist of trend and
completion factors estimated using an assumption of moderately adverse conditions. The amounts below
represent the difference between our original estimates and the actual benefit expenses ultimately incurred as
determined from subsequent claim payments.
71