Humana 2011 Annual Report Download - page 114
Download and view the complete annual report
Please find page 114 of the 2011 Humana annual report below. You can navigate through the pages in the report by either clicking on the pages listed below, or by using the keyword search tool below to find specific information within the annual report.-
 1
1 -
2
-
3
-
4
-
5
-
6
-
7
-
8
-
9
-
10
-
11
-
12
-
13
-
14
-
15
-
16
-
17
-
18
-
19
-
20
-
21
-
22
-
23
-
24
-
25
-
26
-
27
-
28
-
29
-
30
-
31
-
32
-
33
-
34
-
35
-
36
-
37
-
38
-
39
-
40
-
41
-
42
-
43
-
44
-
45
-
46
-
47
-
48
-
49
-
50
-
51
-
52
-
53
-
54
-
55
-
56
-
57
-
58
-
59
-
60
-
61
-
62
-
63
-
64
-
65
-
66
-
67
-
68
-
69
-
70
-
71
-
72
-
73
-
74
-
75
-
76
-
77
-
78
-
79
-
80
-
81
-
82
-
83
-
84
-
85
-
86
-
87
-
88
-
89
-
90
-
91
-
92
-
93
-
94
-
95
-
96
-
97
-
98
-
99
-
100
-
101
-
102
-
103
-
 104
104 -
 105
105 -
 106
106 -
 107
107 -
 108
108 -
 109
109 -
 110
110 -
 111
111 -
 112
112 -
 113
113 -
 114
114 -
 115
115 -
 116
116 -
 117
117 -
 118
118 -
 119
119 -
 120
120 -
 121
121 -
 122
122 -
 123
123 -
 124
124 -
125
-
126
-
127
-
128
-
129
-
130
-
131
-
132
-
133
-
134
-
135
-
136
-
137
-
138
-
139
-
140
-
141
-
142
-
143
-
144
-
145
-
146
-
147
-
148
-
149
-
150
-
151
-
152
-
153
-
154
-
155
-
156
-
157
-
158
-
159
-
160
 |
 |
Humana Inc.
NOTES TO CONSOLIDATED FINANCIAL STATEMENTS—(Continued)
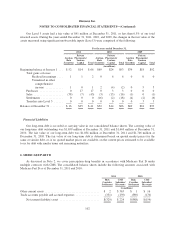
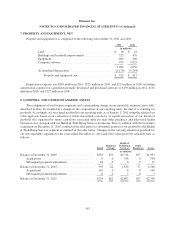
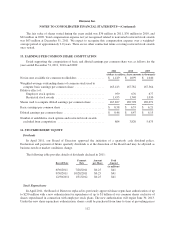
The following table presents details of our other intangible assets included in other long-term assets in the
accompanying consolidated balance sheets at December 31, 2011 and 2010:
Weighted
Average
Life
2011 2010
Cost
Accumulated
Amortization Net Cost
Accumulated
Amortization Net
(in millions)
Other intangible assets:
Customer contracts/relationships .... 10.6 yrs $429 $182 $247 $414 $146 $268
Trade names and technology ....... 15.1 yrs 135 6 129 87 2 85
Provider contracts ............... 15.9 yrs 44 15 29 43 12 31
Noncompetes and other ........... 6.9yrs 40 10 30 19 4 15
Total other intangible assets ....... 11.7 yrs $648 $213 $435 $563 $164 $399
Amortization expense for other intangible assets was approximately $54 million in 2011, $38 million in
2010 and $37 million in 2009. The following table presents our estimate of amortization expense for each of the
five next succeeding fiscal years:
(in millions)
For the years ending December 31,:
2012 ........................................ $64
2013 ........................................ 60
2014 ........................................ 56
2015 ........................................ 49
2016 ........................................ 43
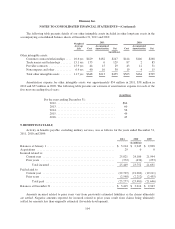
9. BENEFITS PAYABLE
Activity in benefits payable, excluding military services, was as follows for the years ended December 31,
2011, 2010 and 2009:
2011 2010 2009
(in millions)
Balances at January 1 .............................................. $ 3,214 $ 2,943 $ 2,898
Acquisitions ..................................................... 29 0 0
Incurred related to:
Current year ................................................. 25,821 24,186 21,944
Prior years .................................................. (372) (434) (253)
Total incurred ............................................ 25,449 23,752 21,691
Paid related to:
Current year ................................................. (22,729) (21,269) (19,211)
Prior years .................................................. (2,548) (2,212) (2,435)
Total paid ............................................... (25,277) (23,481) (21,646)
Balances at December 31 ........................................... $ 3,415 $ 3,214 $ 2,943
Amounts incurred related to prior years vary from previously estimated liabilities as the claims ultimately
are settled. Negative amounts reported for incurred related to prior years result from claims being ultimately
settled for amounts less than originally estimated (favorable development).
104