Humana 2011 Annual Report Download - page 69
Download and view the complete annual report
Please find page 69 of the 2011 Humana annual report below. You can navigate through the pages in the report by either clicking on the pages listed below, or by using the keyword search tool below to find specific information within the annual report.-
 1
1 -
2
-
3
-
4
-
5
-
6
-
7
-
8
-
9
-
10
-
11
-
12
-
13
-
14
-
15
-
16
-
17
-
18
-
19
-
20
-
21
-
22
-
23
-
24
-
25
-
26
-
27
-
28
-
29
-
30
-
31
-
32
-
33
-
34
-
35
-
36
-
37
-
38
-
39
-
40
-
41
-
42
-
43
-
44
-
45
-
46
-
47
-
48
-
49
-
50
-
51
-
52
-
53
-
54
-
55
-
56
-
57
-
58
-
 59
59 -
 60
60 -
 61
61 -
 62
62 -
 63
63 -
 64
64 -
 65
65 -
 66
66 -
 67
67 -
 68
68 -
 69
69 -
 70
70 -
 71
71 -
 72
72 -
 73
73 -
 74
74 -
 75
75 -
 76
76 -
 77
77 -
 78
78 -
 79
79 -
80
-
81
-
82
-
83
-
84
-
85
-
86
-
87
-
88
-
89
-
90
-
91
-
92
-
93
-
94
-
95
-
96
-
97
-
98
-
99
-
100
-
101
-
102
-
103
-
104
-
105
-
106
-
107
-
108
-
109
-
110
-
111
-
112
-
113
-
114
-
115
-
116
-
117
-
118
-
119
-
120
-
121
-
122
-
123
-
124
-
125
-
126
-
127
-
128
-
129
-
130
-
131
-
132
-
133
-
134
-
135
-
136
-
137
-
138
-
139
-
140
-
141
-
142
-
143
-
144
-
145
-
146
-
147
-
148
-
149
-
150
-
151
-
152
-
153
-
154
-
155
-
156
-
157
-
158
-
159
-
160
 |
 |
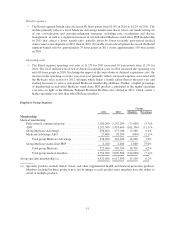
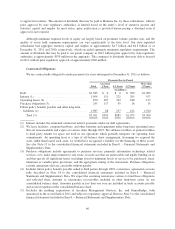
Pretax Results
• Employer Group segment pretax income of $288 million in 2010 increased $301 million from 2009
primarily due to an increase in group Medicare Advantage membership, decreased utilization and our
continued focus on pricing discipline primarily associated with our fully-insured commercial group
products, as well as administrative cost reductions and the previously mentioned favorable prior-period
medical claims reserve development. The Employer Group segment’s pretax income for 2010 included
the beneficial effect of an estimated $33 million in favorable prior-period medical claims reserve
development.
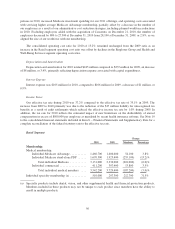
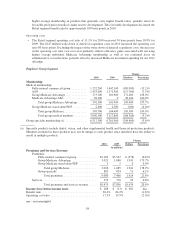
Enrollment
• Fully-insured group Medicare Advantage membership increased 171,200 members from December 31,
2009 to December 31, 2010. Approximately 109,600 of the members were associated with a new
contract added during the first quarter of 2010.
• During 2010, we added 28,200 group Medicare Advantage ASO members due to a new account in
2010.
• Fully-insured commercial group medical membership decreased 189,900 members, or 13.2%, from
December 31, 2009 to December 31, 2010 primarily due to continued pricing discipline.
• Group ASO commercial medical membership decreased 117,700 members, or 7.5%, from
December 31, 2009 to December 31, 2010 primarily reflecting the loss of a large group account on
July 1, 2010.
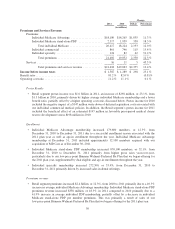
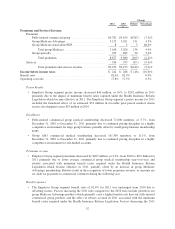
Premiums revenue
• Employer Group segment premiums increased $1.6 billion, or 21.6%, from 2009 to 2010 primarily due
to increased fully-insured group Medicare Advantage membership and an increase in fully-insured
commercial group per member premiums, partially offset by a decline in fully-insured commercial
group medical membership year-over-year. Per member premiums for commercial fully-insured group
accounts increased 7.6% during 2010 compared to 2009.
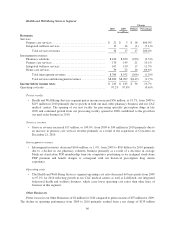
Benefit expenses
• The Employer Group segment benefit ratio of 82.4% for 2010 decreased 180 basis points from 84.2%
for 2009 primarily due to medical trend that was lower than trend assumed in pricing as well as
continued pricing discipline, in each case particularly for our commercial business, and favorable prior-
period medical claims reserve development in 2010. These decreases were partially offset by growth in
our group Medicare Advantage business which generally carries a higher benefit ratio than our fully-
insured commercial group business. Medical trend was favorable, primarily affected by lower
utilization of services as well as the use of services at lower levels of intensity than in the prior year.
The favorable development decreased the Employer Group segment benefit ratio by approximately 40
basis points in 2010. Fully-insured group Medicare Advantage members represented 9.1% of total
Employer Group segment medical membership at December 31, 2010 compared to 3.3% at
December 31, 2009.
Operating costs
• The Employer Group segment operating cost ratio of 17.5% for 2010 decreased 200 basis points from
19.5% for 2009 primarily reflecting administrative scale efficiencies associated with an increase in
average fully-insured group Medicare Advantage membership and our continued focus on
administrative cost reductions.
59