Humana 2011 Annual Report Download - page 52
Download and view the complete annual report
Please find page 52 of the 2011 Humana annual report below. You can navigate through the pages in the report by either clicking on the pages listed below, or by using the keyword search tool below to find specific information within the annual report.-
 1
1 -
2
-
3
-
4
-
5
-
6
-
7
-
8
-
9
-
10
-
11
-
12
-
13
-
14
-
15
-
16
-
17
-
18
-
19
-
20
-
21
-
22
-
23
-
24
-
25
-
26
-
27
-
28
-
29
-
30
-
31
-
32
-
33
-
34
-
35
-
36
-
37
-
38
-
39
-
40
-
41
-
 42
42 -
 43
43 -
 44
44 -
 45
45 -
 46
46 -
 47
47 -
 48
48 -
 49
49 -
 50
50 -
 51
51 -
 52
52 -
 53
53 -
 54
54 -
 55
55 -
 56
56 -
 57
57 -
 58
58 -
 59
59 -
 60
60 -
 61
61 -
 62
62 -
63
-
64
-
65
-
66
-
67
-
68
-
69
-
70
-
71
-
72
-
73
-
74
-
75
-
76
-
77
-
78
-
79
-
80
-
81
-
82
-
83
-
84
-
85
-
86
-
87
-
88
-
89
-
90
-
91
-
92
-
93
-
94
-
95
-
96
-
97
-
98
-
99
-
100
-
101
-
102
-
103
-
104
-
105
-
106
-
107
-
108
-
109
-
110
-
111
-
112
-
113
-
114
-
115
-
116
-
117
-
118
-
119
-
120
-
121
-
122
-
123
-
124
-
125
-
126
-
127
-
128
-
129
-
130
-
131
-
132
-
133
-
134
-
135
-
136
-
137
-
138
-
139
-
140
-
141
-
142
-
143
-
144
-
145
-
146
-
147
-
148
-
149
-
150
-
151
-
152
-
153
-
154
-
155
-
156
-
157
-
158
-
159
-
160
 |
 |
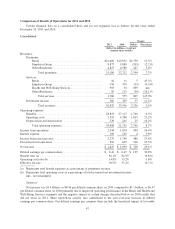
utilize the same provider networks, enabling us in some instances to obtain more favorable contract terms with
providers. Our segments also share indirect costs and assets. As a result, the profitability of each segment is
interdependent. We allocate most operating expenses to our segments. Assets and certain corporate income and
expenses are not allocated to the segments, including the portion of investment income not supporting segment
operations, interest expense on corporate debt, and certain other corporate expenses. These items are managed at
the corporate level. These corporate amounts are reported separately from our reportable segments and included
with intersegment eliminations.
Seasonality
Our Retail segment offers Medicare stand-alone prescription drug plans, or PDPs, under the Medicare Part
D program. These plans provide varying degrees of coverage. Our quarterly Retail segment earnings and
operating cash flows are impacted by the Medicare Part D benefit design and changes in the composition of our
membership. The Medicare Part D benefit design results in coverage that varies as a member’s cumulative
out-of-pocket costs pass through successive stages of a member’s plan period which begins annually on
January 1 for renewals. These plan designs generally result in us sharing a greater portion of the responsibility
for total prescription drug costs in the early stages and less in the latter stages. As a result, the PDP benefit ratio
generally decreases as the year progresses. In addition, the number of low-income senior members as well as
year-over-year changes in the mix of membership in our stand-alone PDP products affects the quarterly benefit
ratio pattern.
Our Employer Group segment also experiences seasonality in the benefit ratio pattern. However, the effect
is opposite of the Retail segment, with the Employer Group’s benefit ratio increasing as fully-insured members
progress through their annual deductible and maximum out-of-pocket expenses.
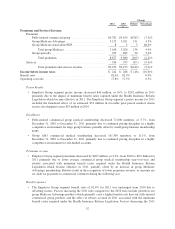
2011 Highlights
Consolidated
• Our strategy and commitment to the Medicare programs have led to significant growth as discussed in
our Retail segment discussion below.
• As more fully described herein under the section titled “Benefit Expense Recognition” actuarial
standards require the use of assumptions based on moderately adverse experience, which generally
results in favorable reserve development, or reserves that are considered redundant. When we
recognize a release of the redundancy, we disclose the amount that is not in the ordinary course of
business. We experienced favorable prior-period medical claims reserve development not in the
ordinary course of business, primarily in our Retail and Employer Group segments, of approximately
$205 million in the aggregate, or $0.77 per diluted common share, for the year ended December 31,
2011 as compared to $231 million in the aggregate, or $0.86 per diluted common share, for the year
ended December 31, 2010. Any discussion of favorable prior-period medical claims reserve
development in our results of operation discussion that follows refers to amounts that were not in the
ordinary course of business.
• In April 2011, our Board of Directors approved the initiation of a quarterly cash dividend policy and
we subsequently declared cash dividends of $0.25 per share to stockholders of record on each of
June 30, 2011, September 30, 2011, and December 30, 2011.
• In addition, in April 2011, the Board of Directors replaced its previously approved share repurchase
authorization of up to $250 million with a new authorization for repurchases of up to $1 billion. The
new authorization will expire June 30, 2013. As of February 6, 2012, the remaining authorized amount
under the new authorization totaled $561 million.
• Comparisons to 2010 are impacted by the $147 million write-down of deferred acquisition costs
associated with our individual commercial medical policies during the year ended December 31, 2010
42