Humana 2011 Annual Report Download - page 45
Download and view the complete annual report
Please find page 45 of the 2011 Humana annual report below. You can navigate through the pages in the report by either clicking on the pages listed below, or by using the keyword search tool below to find specific information within the annual report.-
 1
1 -
2
-
3
-
4
-
5
-
6
-
7
-
8
-
9
-
10
-
11
-
12
-
13
-
14
-
15
-
16
-
17
-
18
-
19
-
20
-
21
-
22
-
23
-
24
-
25
-
26
-
27
-
28
-
29
-
30
-
31
-
32
-
33
-
34
-
 35
35 -
 36
36 -
 37
37 -
 38
38 -
 39
39 -
 40
40 -
 41
41 -
 42
42 -
 43
43 -
 44
44 -
 45
45 -
 46
46 -
 47
47 -
 48
48 -
 49
49 -
 50
50 -
 51
51 -
 52
52 -
 53
53 -
 54
54 -
 55
55 -
56
-
57
-
58
-
59
-
60
-
61
-
62
-
63
-
64
-
65
-
66
-
67
-
68
-
69
-
70
-
71
-
72
-
73
-
74
-
75
-
76
-
77
-
78
-
79
-
80
-
81
-
82
-
83
-
84
-
85
-
86
-
87
-
88
-
89
-
90
-
91
-
92
-
93
-
94
-
95
-
96
-
97
-
98
-
99
-
100
-
101
-
102
-
103
-
104
-
105
-
106
-
107
-
108
-
109
-
110
-
111
-
112
-
113
-
114
-
115
-
116
-
117
-
118
-
119
-
120
-
121
-
122
-
123
-
124
-
125
-
126
-
127
-
128
-
129
-
130
-
131
-
132
-
133
-
134
-
135
-
136
-
137
-
138
-
139
-
140
-
141
-
142
-
143
-
144
-
145
-
146
-
147
-
148
-
149
-
150
-
151
-
152
-
153
-
154
-
155
-
156
-
157
-
158
-
159
-
160
 |
 |

ITEM 1B. UNRESOLVED STAFF COMMENTS
None.
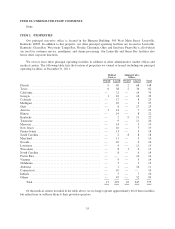
ITEM 2. PROPERTIES
Our principal executive office is located in the Humana Building, 500 West Main Street, Louisville,
Kentucky 40202. In addition to this property, our other principal operating facilities are located in Louisville,
Kentucky; Green Bay, Wisconsin; Tampa Bay, Florida; Cincinnati, Ohio; and San Juan, Puerto Rico, all of which
are used for customer service, enrollment, and claims processing. Our Louisville and Green Bay facilities also
house other corporate functions.
We own or lease these principal operating facilities in addition to other administrative market offices and
medical centers. The following table lists the location of properties we owned or leased, including our principal
operating facilities, at December 31, 2011:
Medical
Centers
Administrative
Offices
Owned Leased Owned Leased Total
Florida ................................................ 9 69 2 68 148
Texas ................................................. 6 38 2 36 82
California .............................................. — 21 — 14 35
Georgia ............................................... 1 16 — 16 33
Colorado .............................................. — 17 — 8 25
Michigan .............................................. — 22 — 3 25
Ohio .................................................. — 8 — 17 25
Arizona ............................................... 1 14 — 7 22
Illinois ................................................ — 14 — 8 22
Kentucky .............................................. — 2 9 11 22
Tennessee ............................................. — 9 — 11 20
Missouri ............................................... — 14 — 5 19
New Jersey ............................................ — 16 — 3 19
Pennsylvania ........................................... — 13 — 5 18
South Carolina .......................................... — 2 8 8 18
Maryland .............................................. — 11 — 5 16
Nevada ................................................ — 10 — 6 16
Louisiana .............................................. — 4 — 11 15
Wisconsin ............................................. — 8 1 6 15
North Carolina .......................................... — 8 — 6 14
Puerto Rico ............................................ — — — 14 14
Virginia ............................................... — 9 — 5 14
Oklahoma ............................................. — 7 — 5 12
Alabama .............................................. — 1 — 10 11
Connecticut ............................................ — 10 — — 10
Indiana ................................................ — 3 — 7 10
Others ................................................ — 47 — 52 99
Total ............................................. 17 393 22 347 779
Of the medical centers included in the table above, we no longer operate approximately 60 of these facilities
but rather lease or sublease them to their provider operators.
35